With their ability to grab attention and convey information quickly and effectively, infographics have become an increasingly popular tool for businesses, educators, and anyone looking to present information in a more engaging and accessible way.
But how do you go about creating one?
We'll go over some tips for engaging infographic designs, and if you don't have the design skills, we'll highlight some of the best places to find a designer.
Value
Penji
- Unlimited revisions with a dedicated designer
- Premium design quality at a fraction of agency rates
- Plans start at $499/mo
Output
Kimp
- Dedicated team delivers 2–4 designs per day
- Video editing add-ons for motion and social content
- Plans start at $699/mo (at 50% off)
Table of Contents
- Penji
- Kimp
- What Is an Infographic?
- Are Infographics Effective?
- Types of Infographics with Examples
- Informational Infographics
- Process Infographics
- Statistical Infographics
- List Infographics
- Timeline Infographics
- What to Consider When Designing an Infographic
- What Are the Benefits of Using Infographics?
- Who Should Hire an Infographic Designer?
- How Much Do Infographic Designers Charge?
- How to Pick an Infographic Designer for Your Business
- Penji
- Kimp
- Frequently Asked Questions
We offer this website completely free to our visitors. To help pay the bills, we’ll often (but not always) set up affiliate relationships with the top providers after selecting our favorites. However, we do our best not to let this impact our choices. There are plenty of high-paying companies we’ve turned down because we didn’t like their product.
An added benefit of our relationships is that we always try to negotiate exclusive discounts for our visitors.
What Is an Infographic?
 An infographic is an image, chart, or graph that includes simple text that gives the viewer a piece of information in an easy-to-digest format.
This information and data are typically pretty short and simple, using different tactics and design styles depending on what information they contain and what they are trying to communicate.
These have been popular in recent years as they combine imagery with information to make big ideas and data easier to understand.
Infographics are used in nearly every industry, from health and fitness to education to digital marketing.
We offer this website completely free to our visitors. To help pay the bills, we’ll often (but not always) set up affiliate relationships with the top providers after selecting our favorites. However, we do our best not to let this impact our choices. There are plenty of high-paying companies we’ve turned down because we didn’t like their product.
An added benefit of our relationships is that we always try to negotiate exclusive discounts for our visitors.
Are Infographics Effective?
Due to their eye-catching design and simplicity in the way they communicate data, infographics are incredibly effective.
This is due to human nature and the way our brains work. People can process images thousands of times faster than text, so putting small amounts of text within an image is a sort of mental hack to get an audience to understand things better and more quickly.
When designed well, infographics can capture and hold people’s attention and memorably communicate ideas.
Types of Infographics with Examples
 Some schools of thought believe that there are 3 types of infographics, while others believe there are upwards of a dozen subcategories.
These 5 are the most commonly used.
Informational Infographics
Informational infographics are usually composed only of images and text, not charts or graphs.
These types of infographics use tidbits of information and organized formatting, different eye-catching colors, and simple designs.
Example

Process Infographics
Process infographics are designed to explain a process or steps to doing something in an attractive way.
These often use flowcharts, arrows, or numbers to explain step-by-step what needs to happen.
Example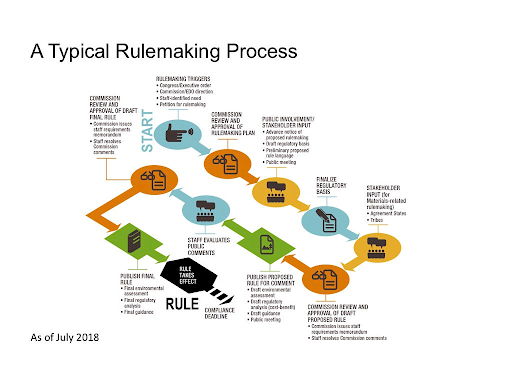
Statistical Infographics
Statistical infographics use typography, charts, and graphs to create visual representations of statistics and data.
These are designed to make otherwise underwhelming data easier to understand than plain tables.
Example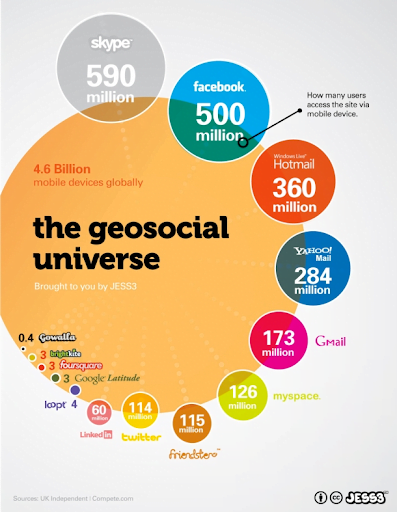
List Infographics
List infographics appealingly summarize lists of information. This could include items or factors, or even could be used as a process infographic.
Example

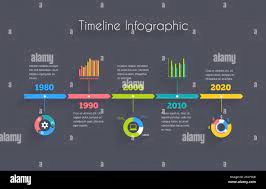
Timeline Infographics
Timeline infographics use imagery and information to show change over time and outline how things happen in chronological order.
Example
What to Consider When Designing an Infographic
 It’s not a great idea to just rush into designing an infographic without some careful planning and consideration.
Accurate Information
Since this is the “info” part of the infographic, it’s important to analyze the data or information you are trying to communicate through your infographic.
Do your research, attentively look through your data, and fact-check your information before you begin the design process, so you can be sure that your infographic is actually informative and useful to your audience.
Clean Design
It’s easy to overload your infographic with too much information or a cluttered design. Keep things simple.
Format the information in a way that makes the information easy to digest and attractive without over-designing or over-complicating the visual imagery of the infographic.
What Type of Infographic Works Best
There is some overlap in what infographics fit which type, but you should choose the format of an infographic that makes sense for the information you are trying to communicate.
Trying to teach someone step-by-step how to do something? Use a process infographic. Need to use charts, tables, or graphs to communicate your info? Use a statistical infographic.
Be Intentional
Before you create an infographic, you should know the who, what, where, when, and why, and design your infographic accordingly.
Lay information out in a way that makes sense, use colors and images that fit the information presented, and organize thoughts and ideas intentionally. The flow should make sense and be easy to read and understand.
What Are the Benefits of Using Infographics?
Improve Retention and Engagement
Whether you’re using infographics for digital marketing, teaching, or training for the workplace, you need your audience to be interested and stay interested. The longer they linger, the more effective the information becomes.
Using infographics is a more palatable format to share information, which will make your audience more likely to stick around and read the info contained.
Especially in digital marketing, you want to get your information in front of as many eyes as possible.
An infographic gives people all the necessary info in an easily shareable (and more attractive) format, which people will be more likely to share on social media and in a more accessible way than, say, a link.
Visually Appealing and Eye-Catching
In the endless scroll, you have to give folks a good reason to stop and look.
Infographics, when done well, are prettier and more attention-grabbing than regular charts or just text.
Who Should Hire an Infographic Designer?
 Companies that heavily depend on communicating important information to the public should hire a designer to make their infographics.
For smaller businesses or teachers, there are cheap, or even free templates available online that make it easy to create a simple infographic.
How Much Do Infographic Designers Charge?
Infographic designers can charge a wide range of prices, depending on their level of experience, capabilities, and the scope of the project.
Many infographic designers will charge a per-project fee starting at $100 and going up to $1,000 and beyond.
How to Pick an Infographic Designer for Your Business
 To pick an infographic designer for your website, you need to first figure out your budget.
If you are on a tight, inflexible budget and don’t need a particularly fancy infographic, it’s completely fine to use a free or cheap template online.
If you do decide to hire someone, check out freelancer marketplace sites like Fiverr or Upwork, or you can create your own with Designcap.
Check out the profiles and information on each designer to see if they specialize in infographic design for your industry, as these folks will already have some base-level knowledge of what customers in that field are looking for.
You can also choose an unlimited graphic design service like Kimp or Graphically that can provide you with infographic designs as well as unlimited requests for any other graphic design needs you may have in the future.
Value
Penji
- Unlimited revisions with a dedicated designer
- Premium design quality at a fraction of agency rates
- Plans start at $499/mo
Output
Kimp
- Dedicated team delivers 2–4 designs per day
- Video editing add-ons for motion and social content
- Plans start at $699/mo (at 50% off)
Frequently Asked Questions
What does an infographic mean?
The term infographic is used to describe anything that contains both imagery and typography to communicate information.
Where can I find free infographics?
Free infographic templates are available on Canva, Piktochart, Venngage, and other similar sites.
What are the types of infographics?
Types of infographics include informational, process, statistical, list, and timeline.
What is the purpose of infographics?
The purpose of infographics is to communicate big ideas and information in a way that’s attractive, understandable, and engaging to an audience.