Web access has become such an important part of everyday life that the UN has been challenged to call it a human right. Given the gravity of that statement, it's pretty clear we need to ensure easy access for people with disabilities.
It's not only the right thing to do, but also, from a legal and business standpoint, it saves you money and can only improve your profits.
There are more than 2 billion disabled people in the world, so the push for open web design is very important.
Even though laws and technology have gotten better, many websites still don't meet WCAG standards, which could lead to legal and financial problems. Don’t let your website be one of them.
Let’s take a look at these 57 facts to learn more about the importance, challenges, and future of web accessibility. You’ll see that web accessibility is both an ethical duty and a smart business choice. Wins all around.
Key takeaways:
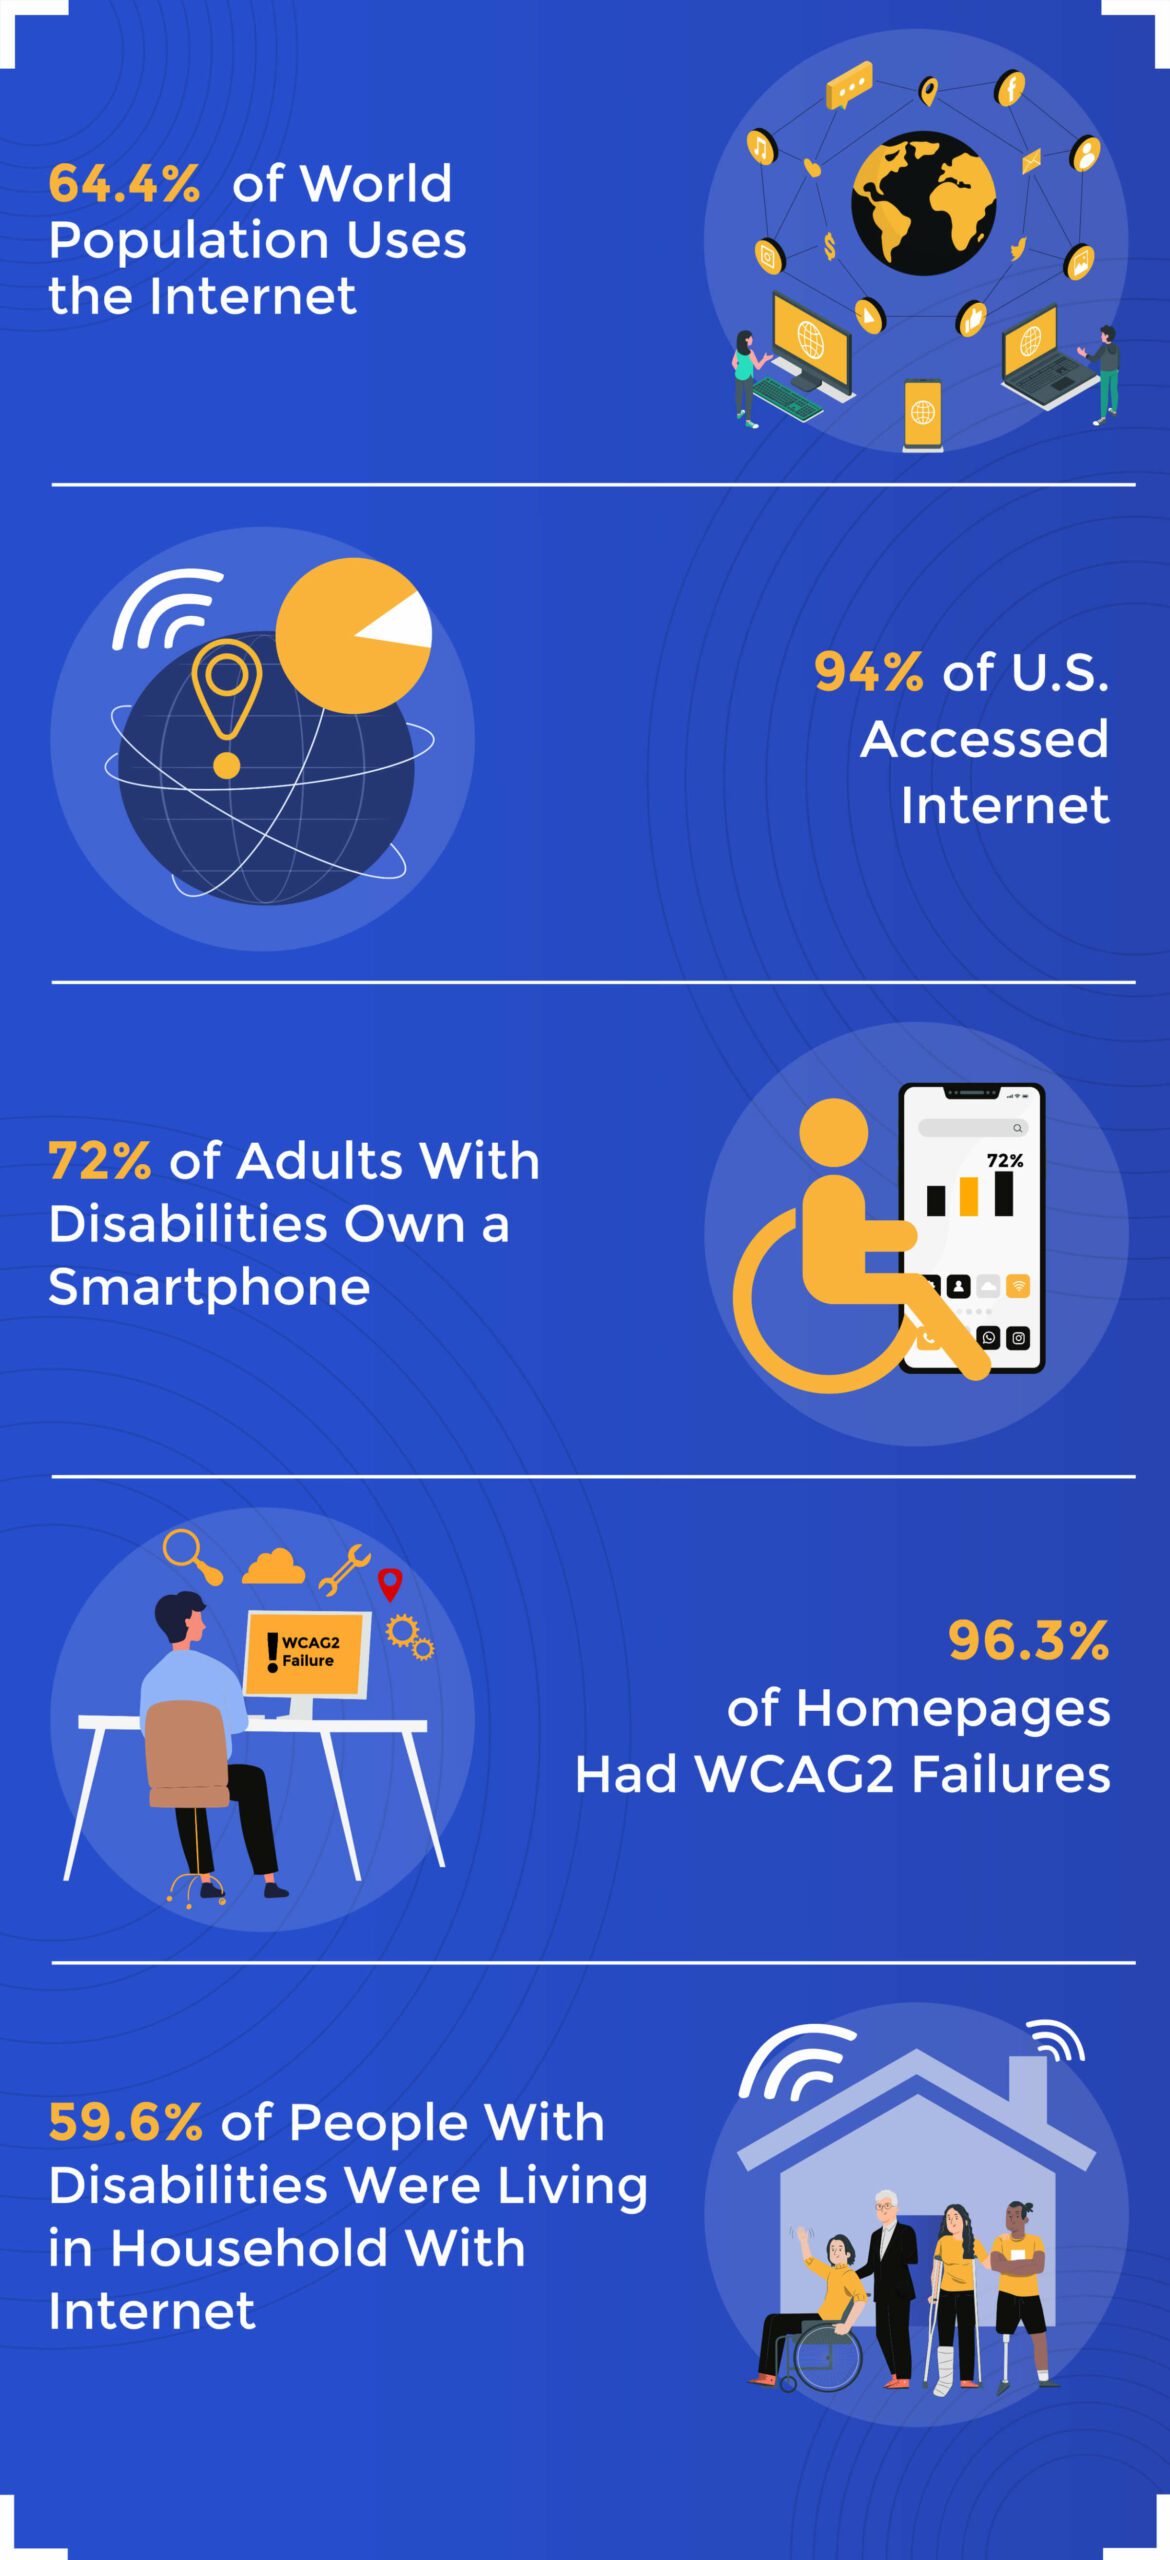
1. 64.6% of the worlds total population uses the internet
2. As of 2024, approximately 94% of the United States accessed the internet
3. 59.6% of the U.S population with disabilities were living in a household with internet access
4. 72% of adults with disabilities own a smartphone
5. 96.3% of homepages had detectable WCAG 2 failures
Table of Contents
- General Internet Usage & Access Statistics
- What Percentage of the World Has Access to the Internet?
- What Percentage of U.S. Households Have Internet Access?
- Key Web Accessibility Statistics
- How Many People Need Website Accessibility Modifications?
- How Websites Fall Short of Offering Accessible Features
- Web Accessibility Efforts Are Increasing
- Legal Ramifications for Websites Without Accessibility Features
- Make Web Accessibility the Norm
- 8 Steps To Make Your Website Accessible
- Conclusion
We offer this website completely free to our visitors. To help pay the bills, we’ll often (but not always) set up affiliate relationships with the top providers after selecting our favorites. However, we do our best not to let this impact our choices. There are plenty of high-paying companies we’ve turned down because we didn’t like their product.
An added benefit of our relationships is that we always try to negotiate exclusive discounts for our visitors.
General Internet Usage & Access Statistics
- From 2000 to the end of 2023, internet usage increased by 1,355%.
- A total of 5.18 billion people around the world use the internet at the start of 2024.
- In 2024, nearly 60% of all internet traffic worldwide is conducted on mobile devices.
- 65.74% of internet users use Google Chrome as their primary browser.
- Internet users are reported to increase at an annual rate of 3.5%.
- As of January 2024, the global reach of social media has grown to 5.35 billion people.
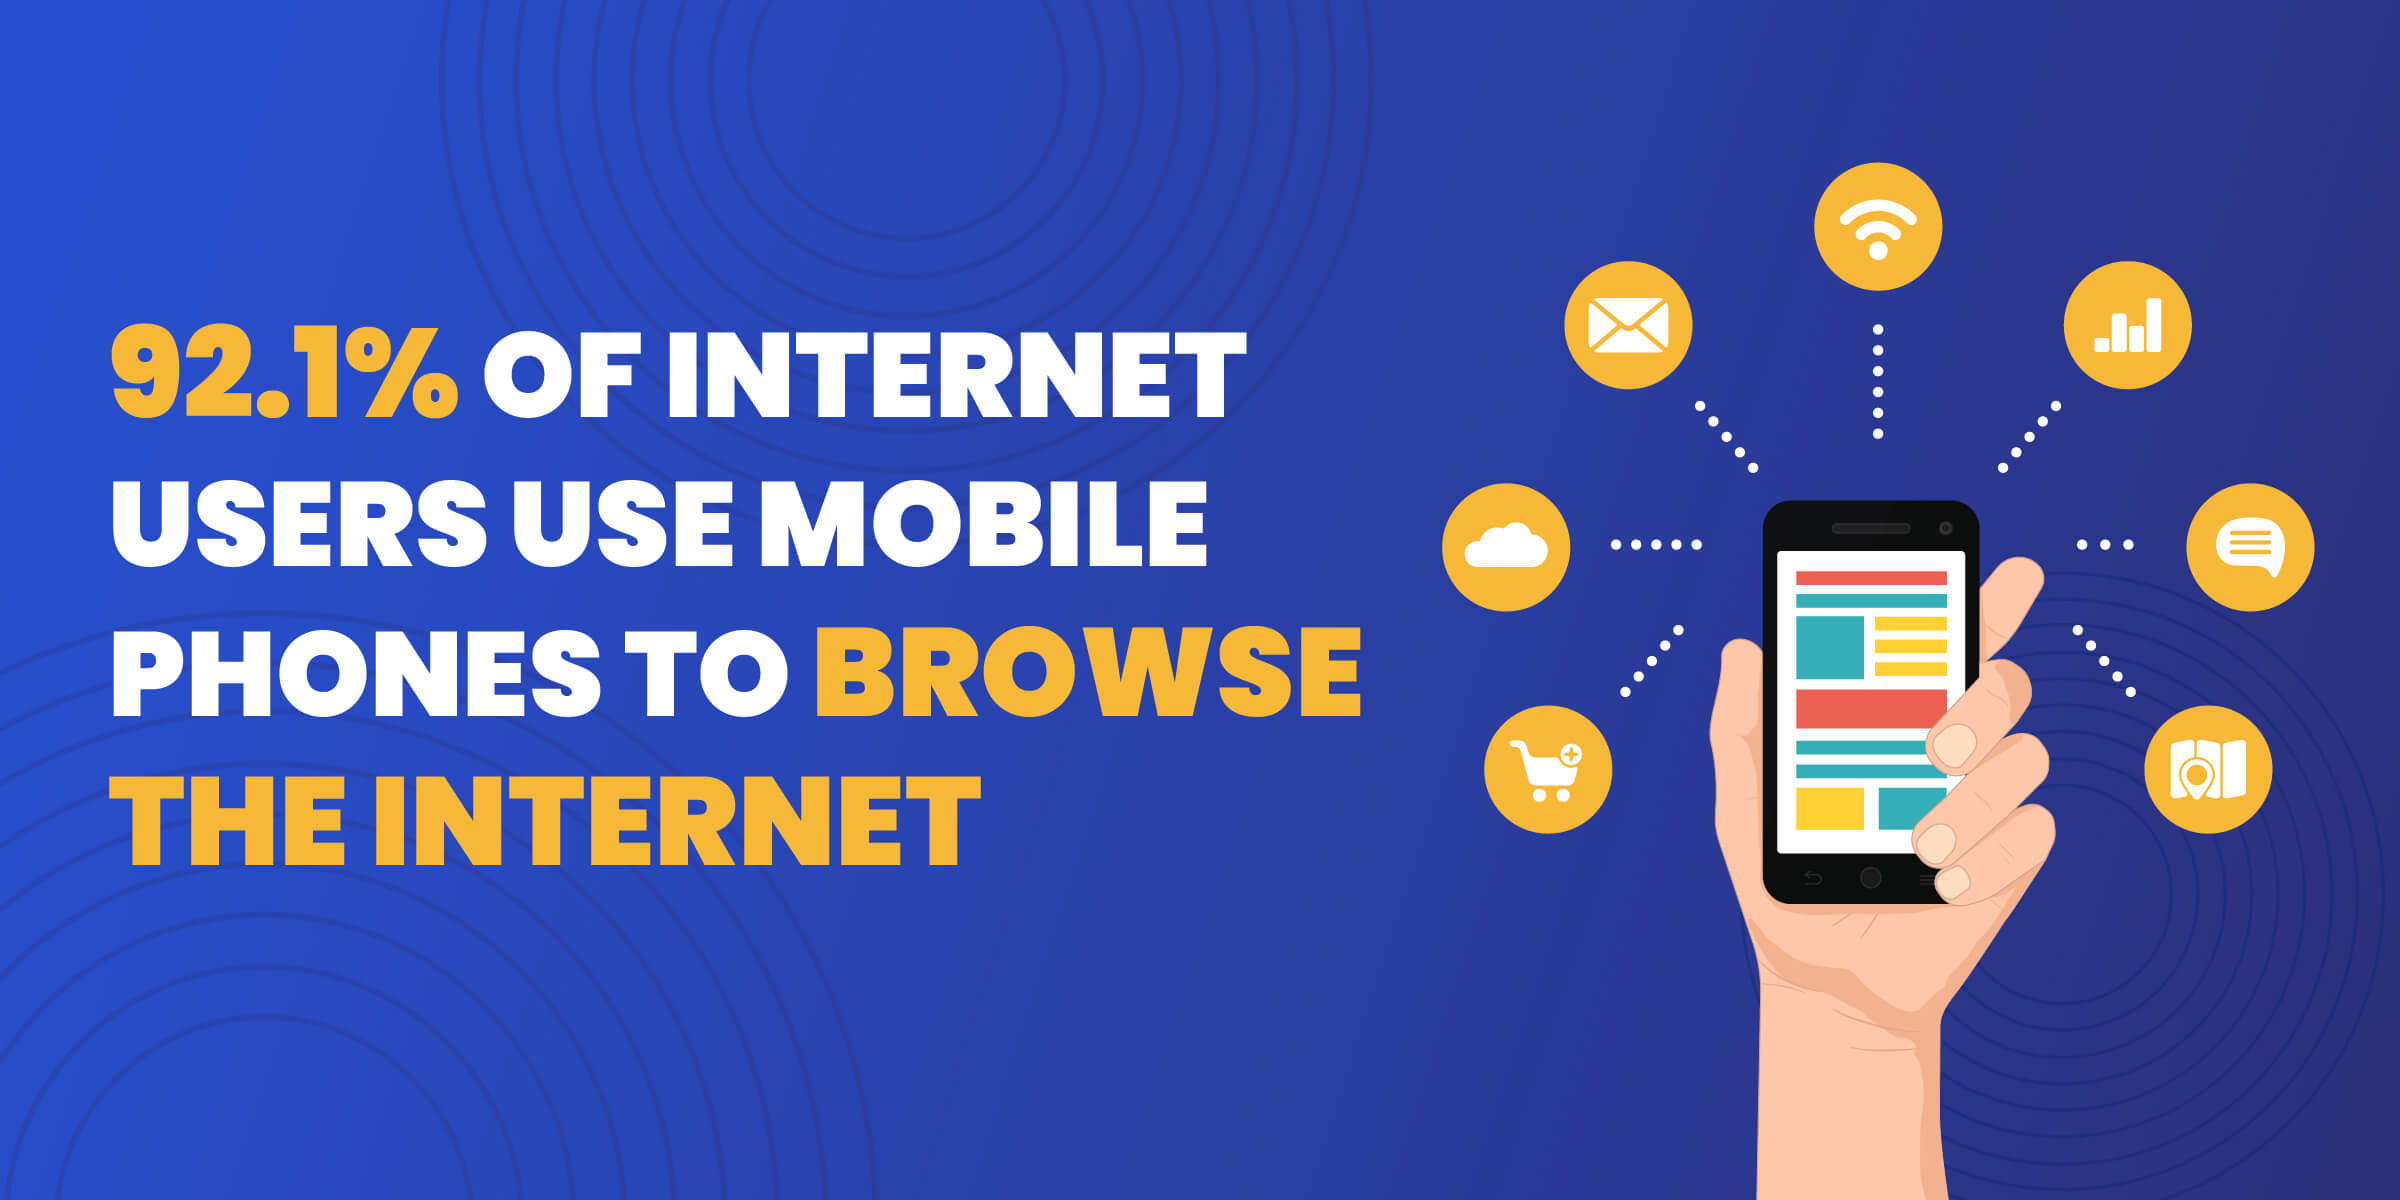
- 92.1% of internet users use mobile phones to browse the internet.
What Percentage of the World Has Access to the Internet?
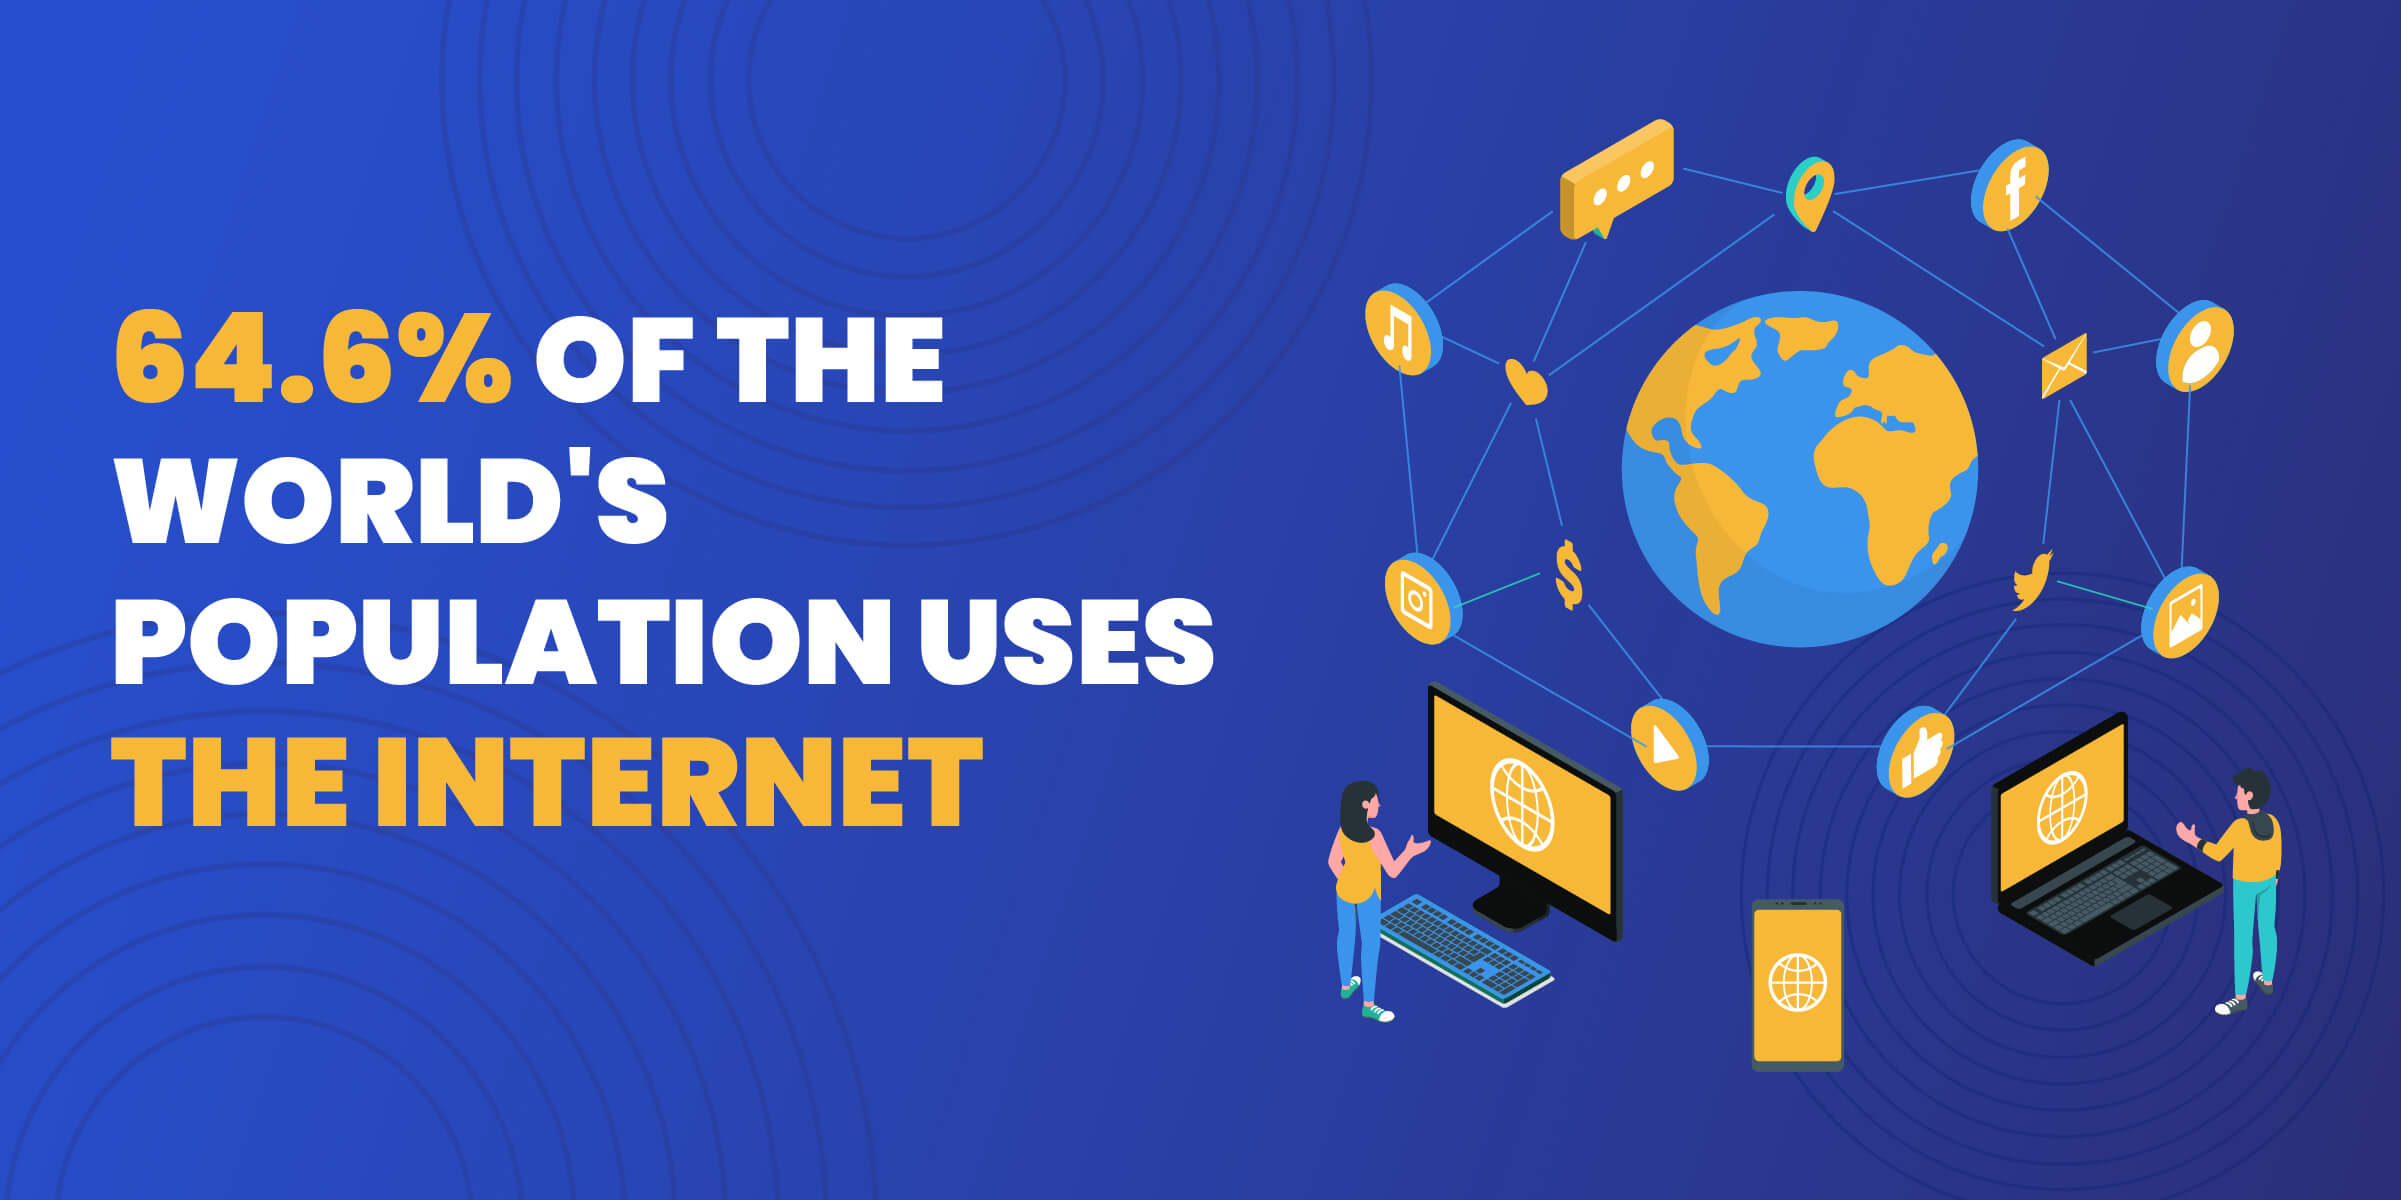
- 64.6% of the world's total population uses the internet.
- The population of the world using the internet grew by 4.7% in 2023.
- The number of people without access to the internet has fallen to 2.6 billion this year.
- China ranks first in the number of internet users with over 1 billion internet users.
What Percentage of U.S. Households Have Internet Access?
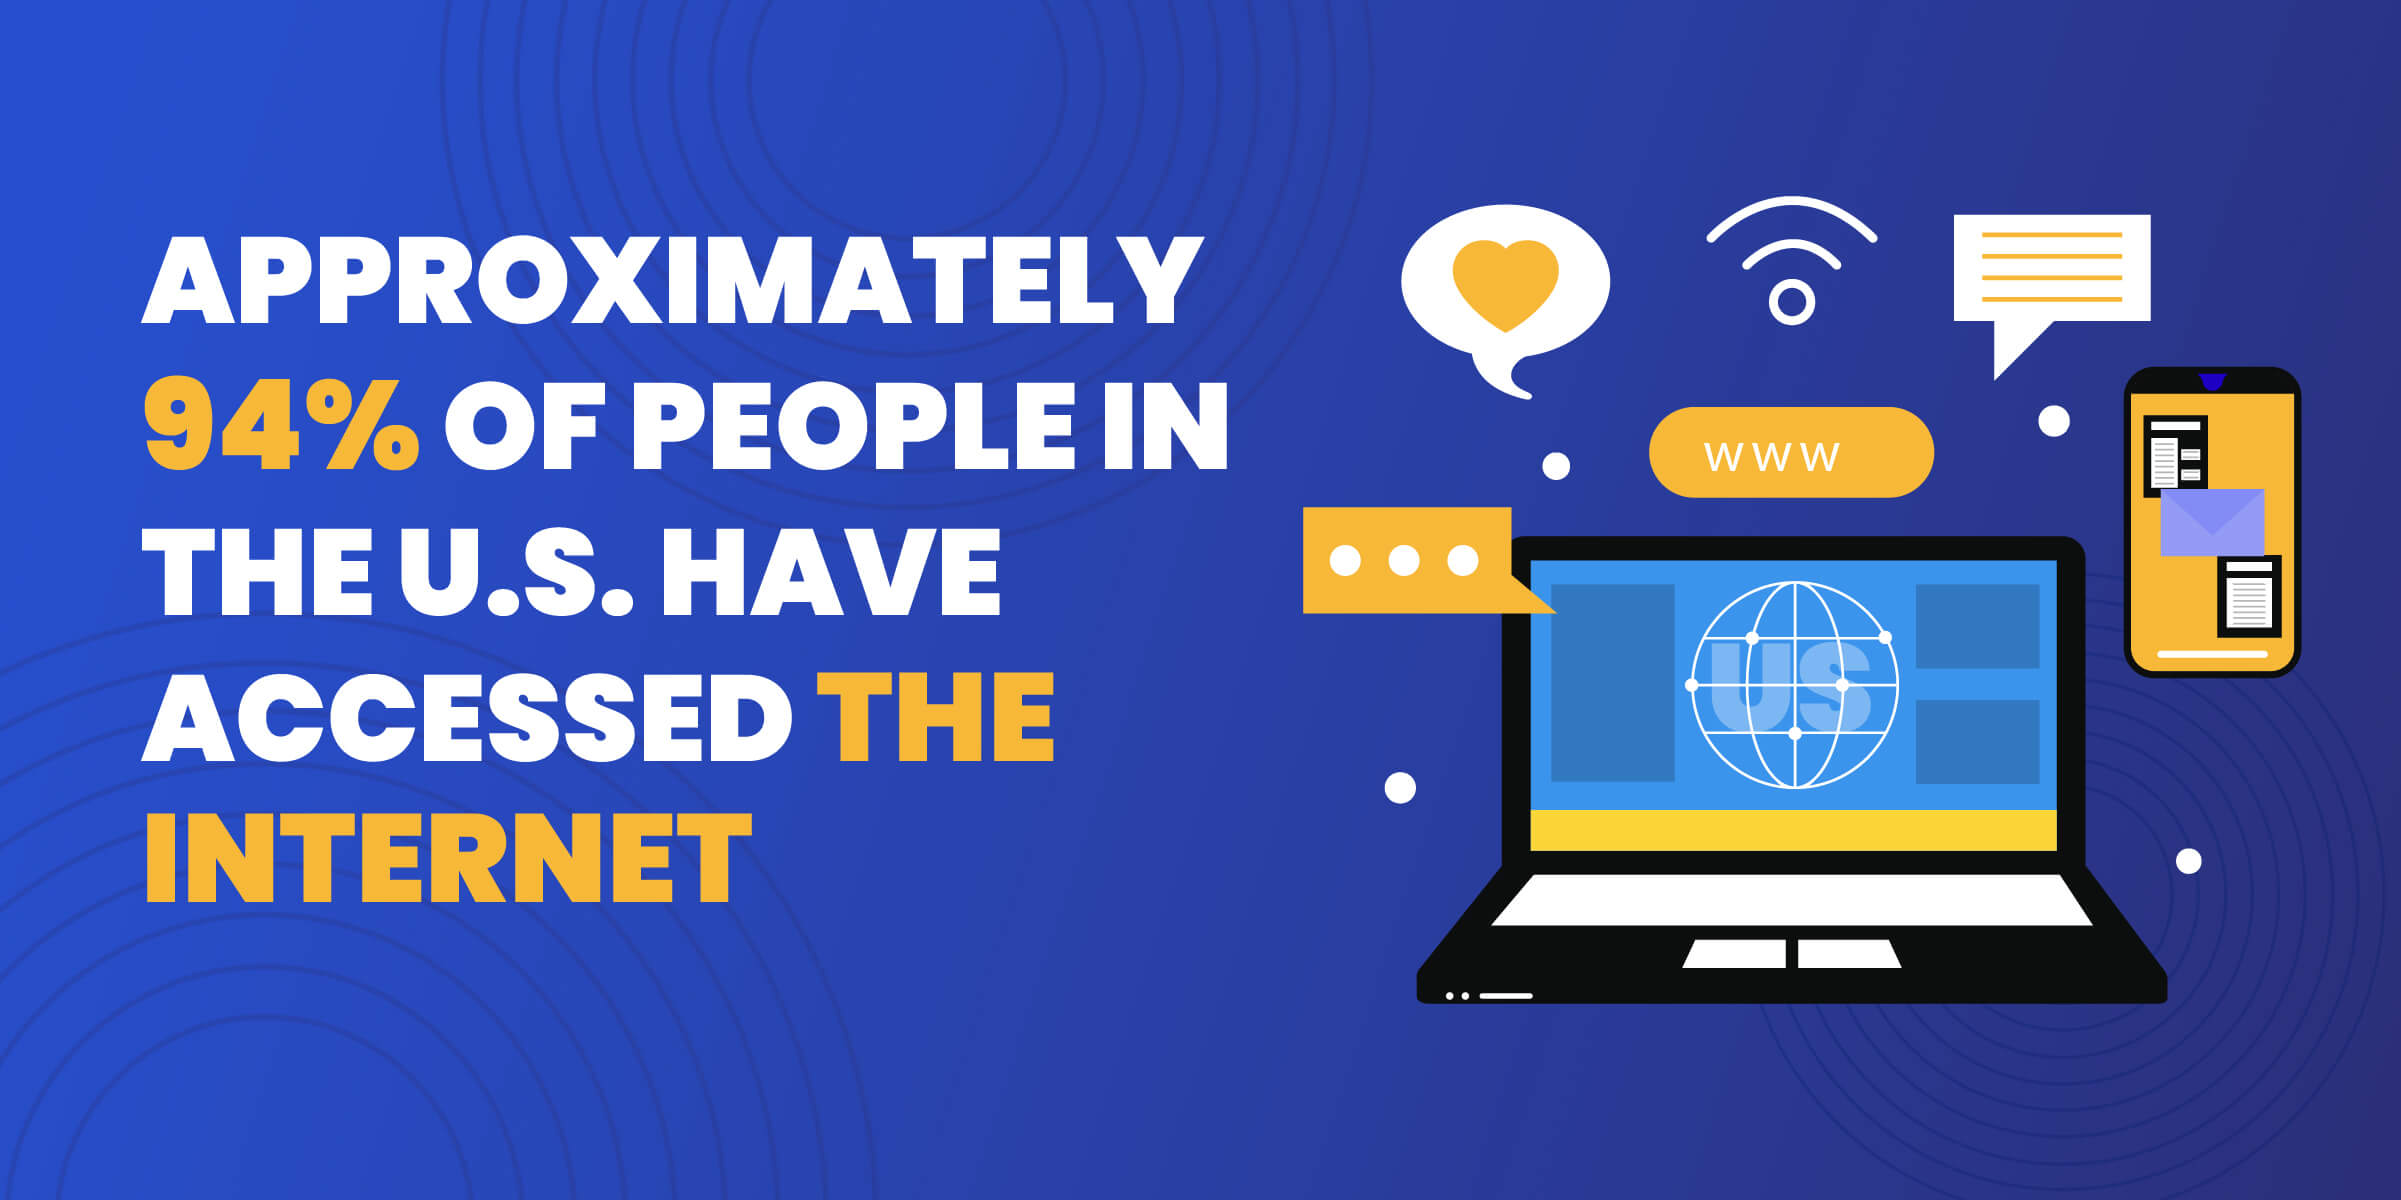
- As of 2024, approximately 93.79% of people in the United States accessed the Internet.
- This is a significant increase from nearly 75% in 2012.
- There were nearly 299 million internet users in the US in 2022.
15. What percentage of websites use WordPress? As of 2023, the number of websites using WordPress around the globe is 455 million, making up 42.7% of all websites.
Key Web Accessibility Statistics
Before we get into the more specific types of statistics surrounding this important and complex issue, let’s look at the big picture.
- 15% of the world's population has some sort of disability.
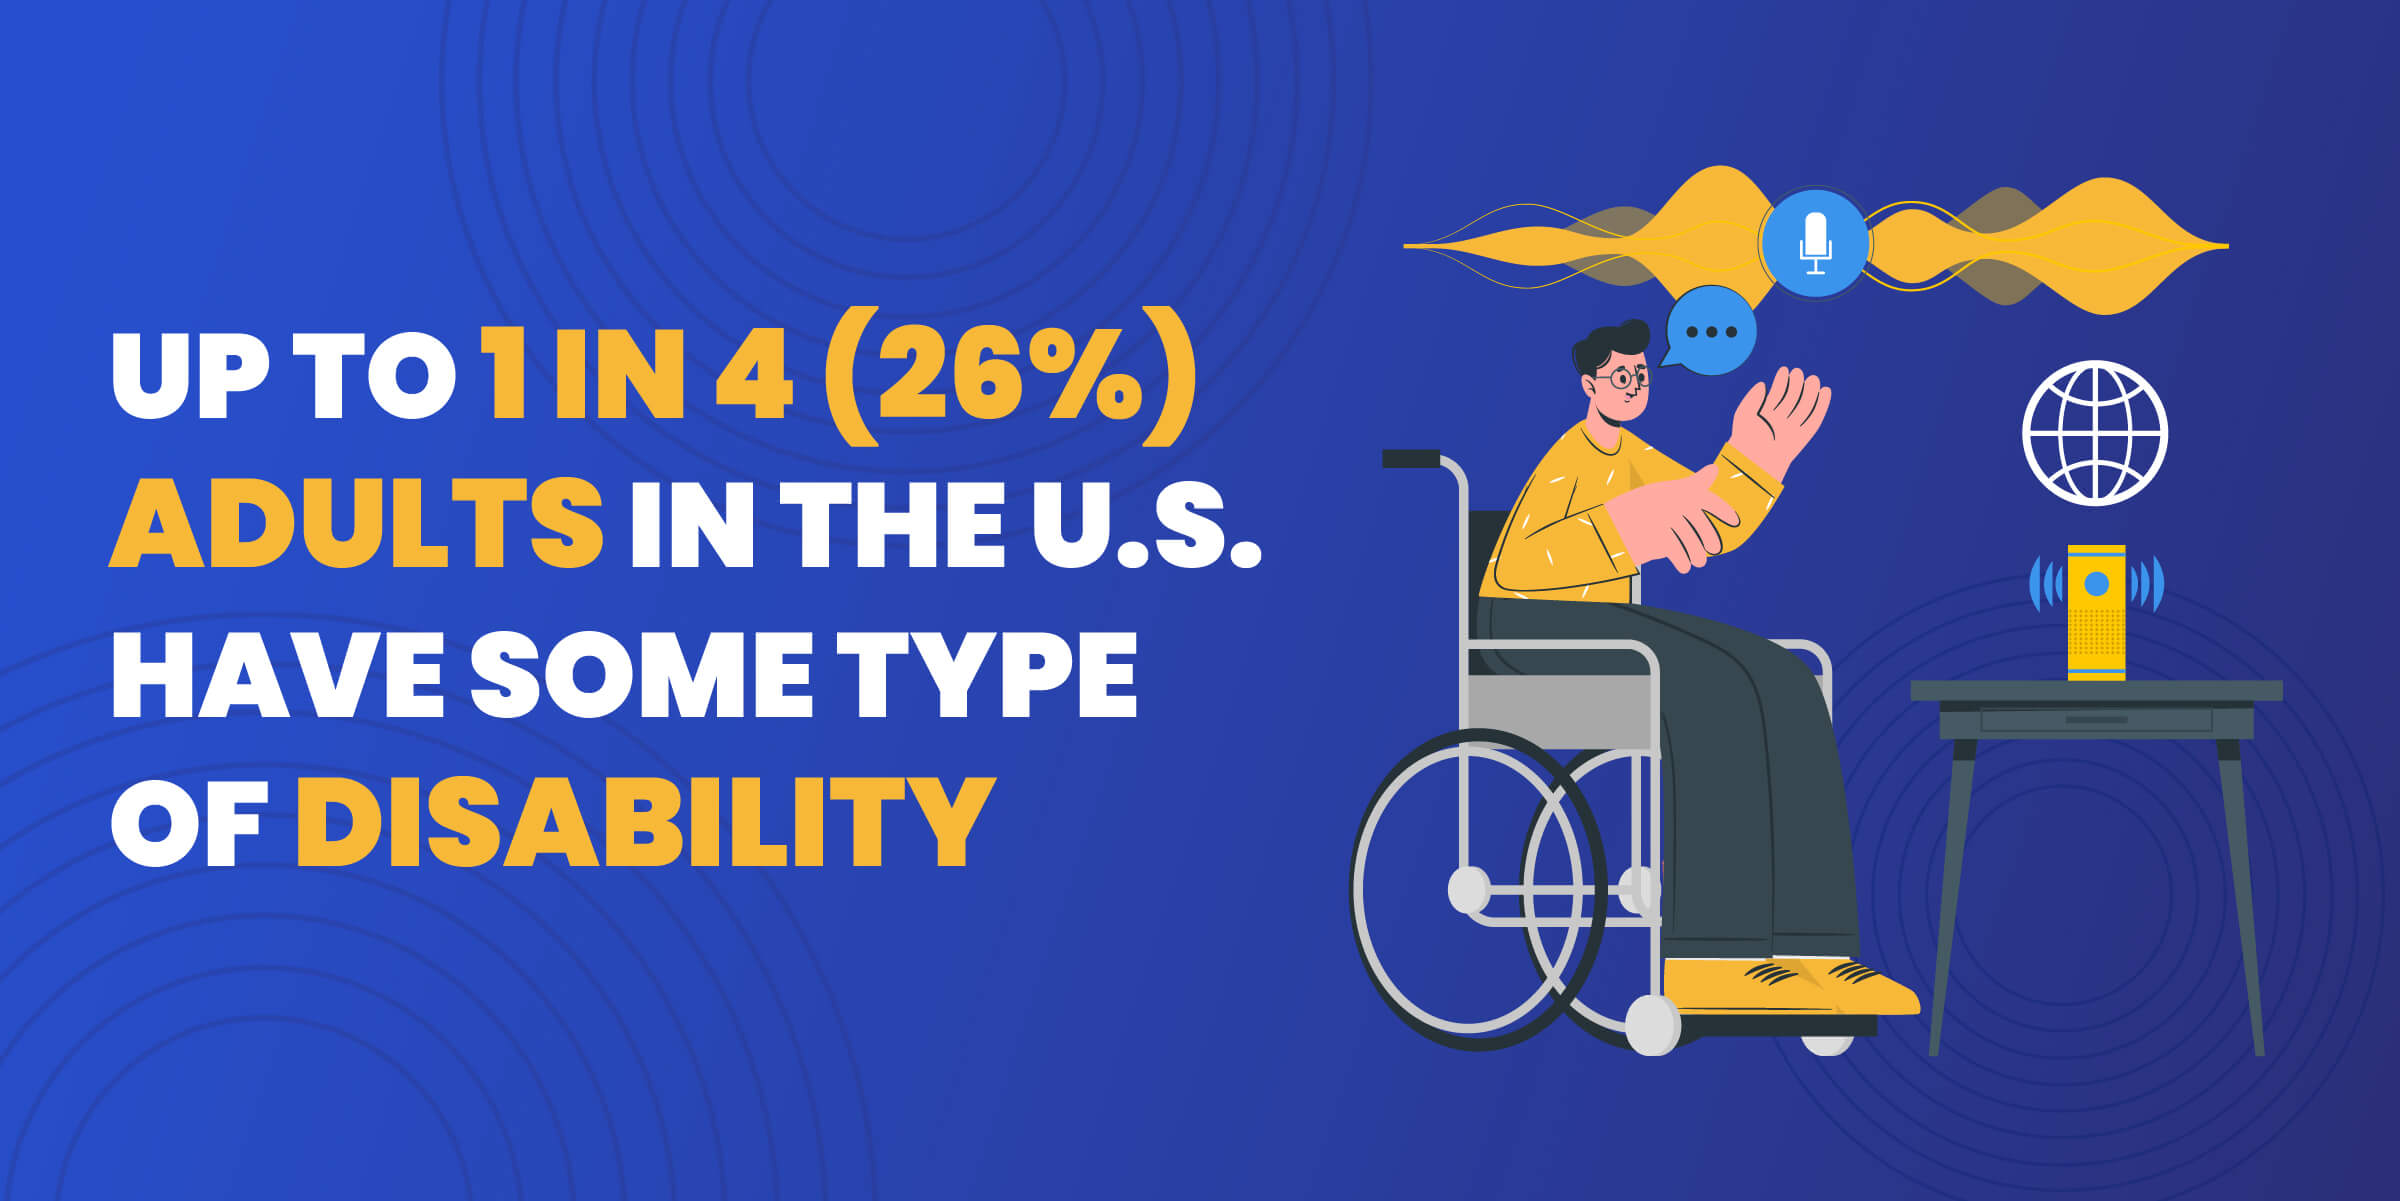
- Up to 1 in 4 (26%) adults in the United States have some type of disability.
- 59.6% of the U.S. population with disabilities were living in a household with internet access.
- 62% of adults with a disability own a laptop or desktop computer compared to 81% of adults without a disability.
- 72% of adults with disabilities own a smartphone.
- According to the Web AIM Million Report researching one million websites, the number of detectable accessibility errors was 50.8 on average per home page. This was a minor improvement from 51.4 errors one year ago.
Now that you can understand the scope of the situation, let’s look at more of the surprising numbers related to web accessibility.
How Many People Need Website Accessibility Modifications?
Though millions of people are living with disabilities, these disabilities can look different from person to person.
Not every disability negatively affects a person’s ability to access the internet through a computer or a smartphone, but many of the disabilities that affect people create barriers and difficulties in accessing and processing some web pages.
Here are the numbers regarding how many people have disabilities that make accessibility features necessary when surfing the internet.
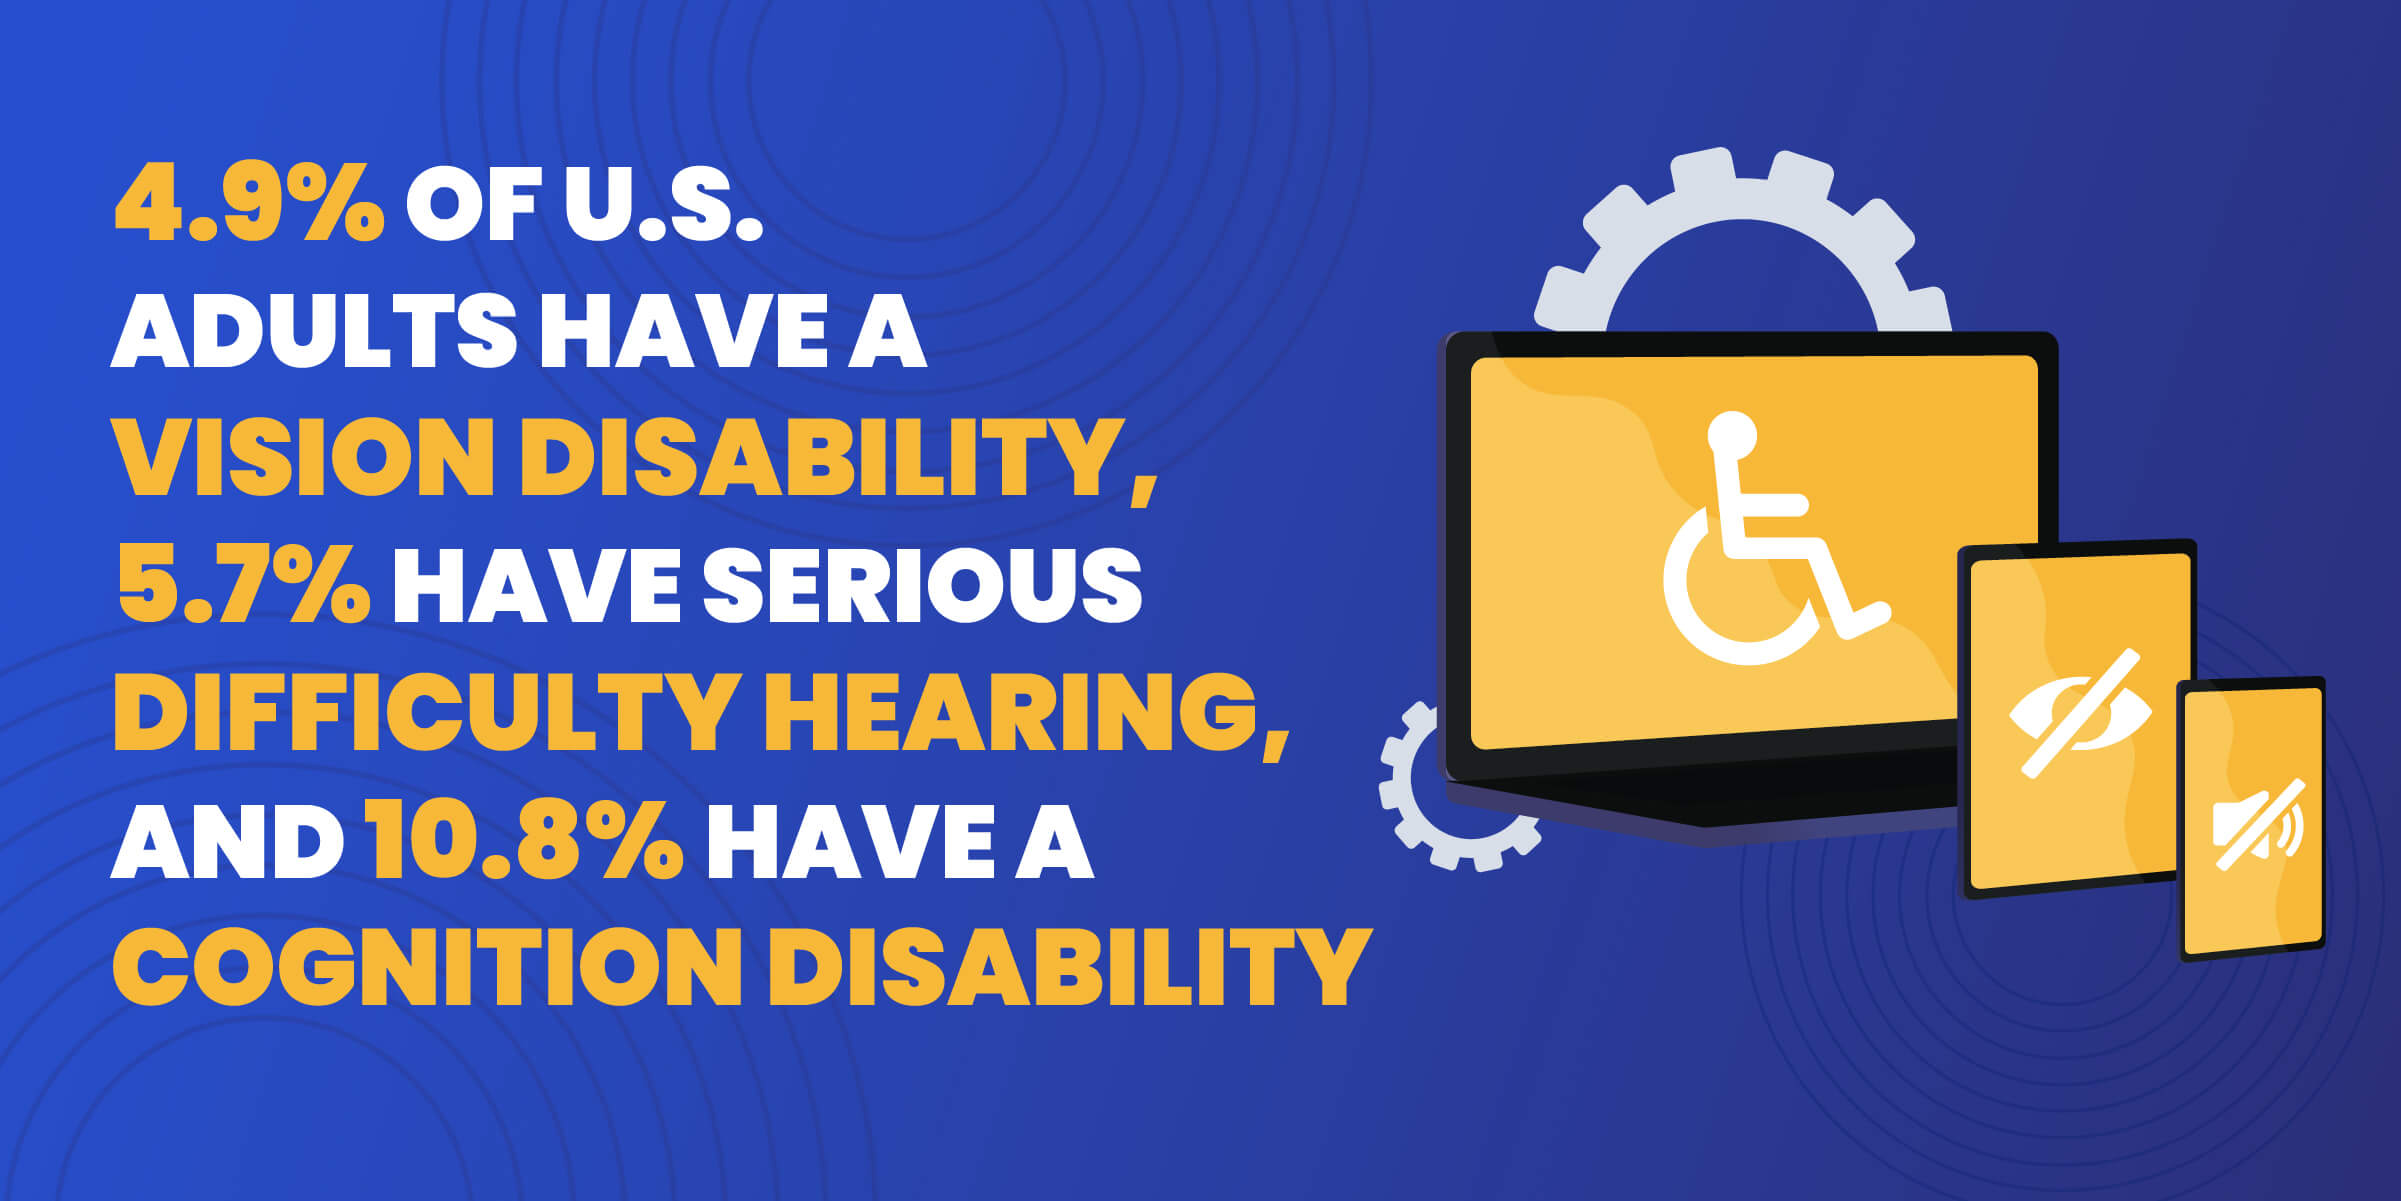
- 4.9% of U.S. adults have a vision disability with blindness or serious difficulty seeing even when wearing glasses, requiring screen readers.
- 5.7% of U.S. adults are deaf or have serious difficulty hearing.
- 10.8% of people with a disability have a cognition disability with serious difficulty concentrating, remembering, or making decisions.
- There are an estimated 300 million people in the world with color vision deficiency which requires color-adjusting tools on sites.
- About 16% of people who use screen readers have multiple disabilities.
- Roughly a quarter of Americans with disabilities (26%) say they have high-speed internet at home, a smartphone, a desktop or laptop computer, and a tablet compared with 44% of those who report not having a disability.
- 18% of US adults report that they have a disability, according to this survey, which asked respondents if any “disability, handicap, or chronic disease keeps you from participating fully in work, school, housework, or other activities.”
- Americans with disabilities are three times as likely as those without a disability to say they never go online (15% vs. 5%.)
- By 2050 nearly 2.5 billion people are projected to have some degree of hearing loss and at least 700 million will require hearing rehabilitation.
- By 2060 the number of people 65 or older is expected to double to 98 million.
How Websites Fall Short of Offering Accessible Features
Unfortunately, many websites fall painfully short of providing accessible modifications that make their pages available to people with certain disabilities.
These are the most significant areas for improvement that every website owner needs to address to ensure easy usage and a positive user experience for all people.
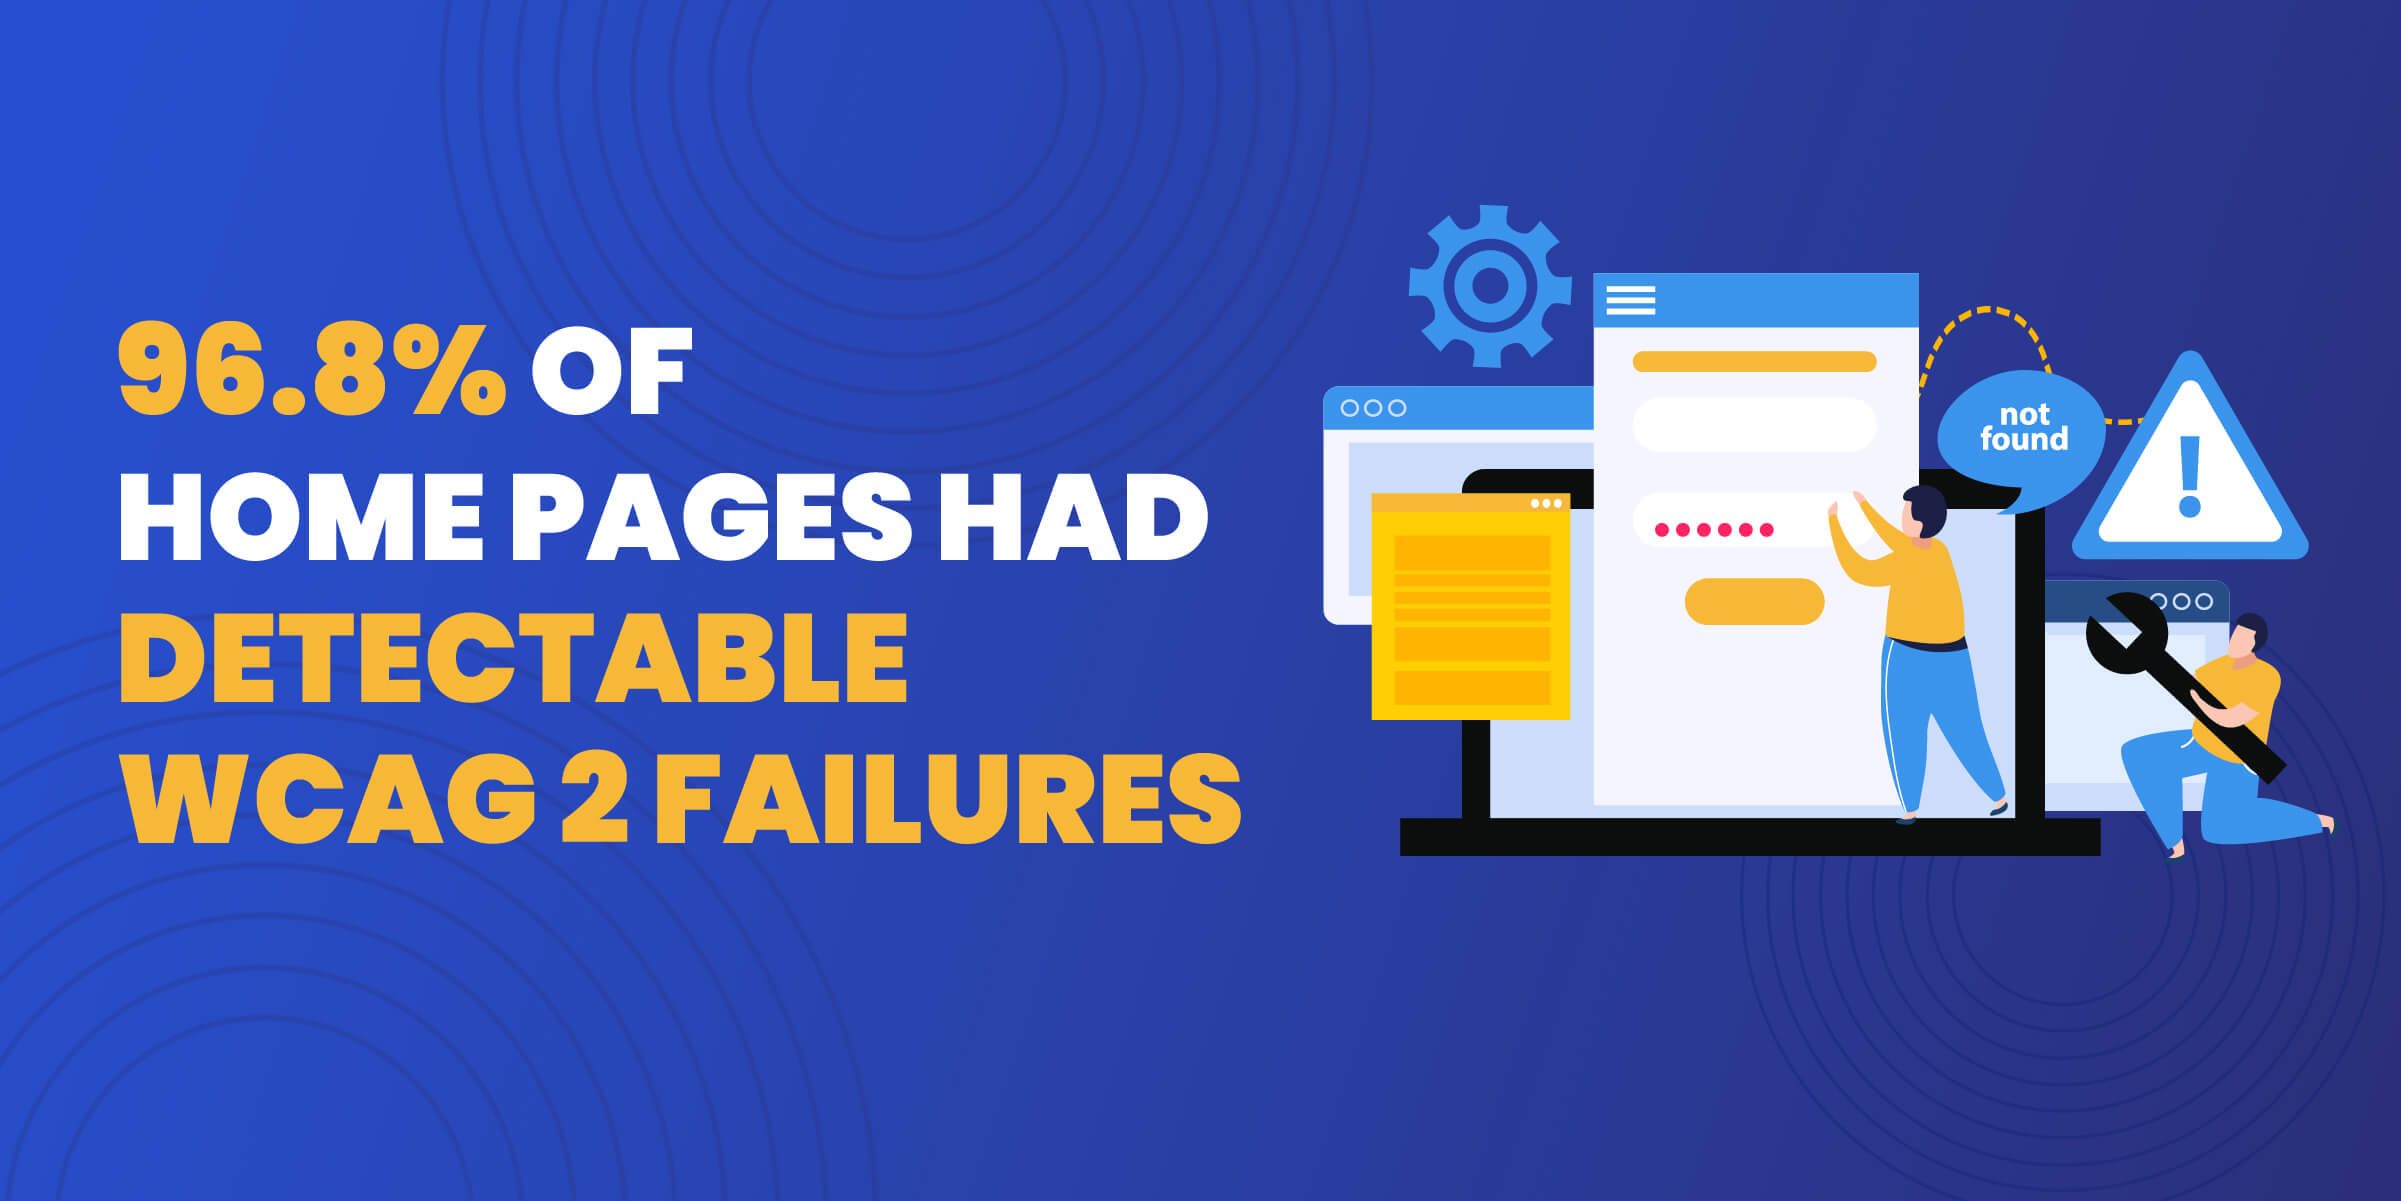
- 96.8% of home pages had detectable WCAG 2 failures.
- Home pages most commonly had low-contrast text, missing alternative text, empty links, missing form input labels, empty buttons, and missing document language. 96.5% of all errors detected fall into these six categories.
- 84% of home pages had low-contrast text.
- 23% of images had missing alternative text and over one-third of all images analyzed had detectable accessibility issues.
- 39% of the 4.4 million form inputs detected were not properly labeled.
- 86% of home pages had a valid HTML5 doctype. HTML5 pages had nearly double the page elements and 15% more accessibility errors than pages with other doctypes.
- 92% of the most popular federal websites fail to meet basic standards for accessibility, according to a study from the Information Technology and Innovation Foundation.
- Home pages with ARIA present averaged 70% more detectable errors (23 additional potential barriers per page) than those without ARIA.
- In 2023, Utah State University’s Web AIM Million Project reported that 96.3% of homepages were not compliant, with an average of 50 barriers.
- Since the guidelines are so nuanced and interpretive, automated tools can only detect ~30% of WCAG issues.
- 90% of websites are inaccessible to people with disabilities who use assistive technologies.
Web Accessibility Efforts Are Increasing
Though some of those numbers can seem disparaging at first glance, many websites have begun to take steps to facilitate more inclusive practices in the operational functions of their sites.
Here are a few ways that companies are working toward building a better future for web accessibility.
- 89.1% of web accessibility practitioners indicated that better websites would have a bigger impact on accessibility than better assistive technology and browsers in 2021. This is an increase from 83.1% in 2018, showing that practitioners have placed additional responsibility on websites over time.
- The percentage of home pages that had detectable WCAG 2 failures (96.3%) was a small improvement from 96.8% in 2022, 97.4% in 2021, and 98.1% in 2020.
- The percentage of missing alternative text for images on home pages has improved every year since 2019. In 2019 that number was 68.0%, in 2020 it was 66.0%, in 2021 it was 60.6%, and in 2022 it was 55.4%.
- 39% of the 4.4 million form inputs identified were not properly labeled which is a notable improvement from 45% in 2021, 55% in 2020, and 59% in 2019.
- Home pages in the Food and Drink category were most improved since 2020 with errors reduced from 66.1 to 46.4 errors on average.
- Shopping sites, which were also highly subject to accessibility complaints and lawsuits, were greatly improved from 90.5 errors to 72.9 errors on average over two years.
Legal Ramifications for Websites Without Accessibility Features
Aside from the obvious benefit of creating a website that allows access to more people, there are some serious legal ramifications to avoiding important updates.
Multiple ADA-based lawsuits have been filed against companies who have failed to make their websites ADA-compliant.
- Since 2019, there has been an average of 13% year-on-year increase in web accessibility-related lawsuits.
- 2023 yielded 3,086 federal ADA lawsuits and 1,519 state suits, for a grand total of 4,605.
- 2,281 website accessibility lawsuits were filed in 2023.
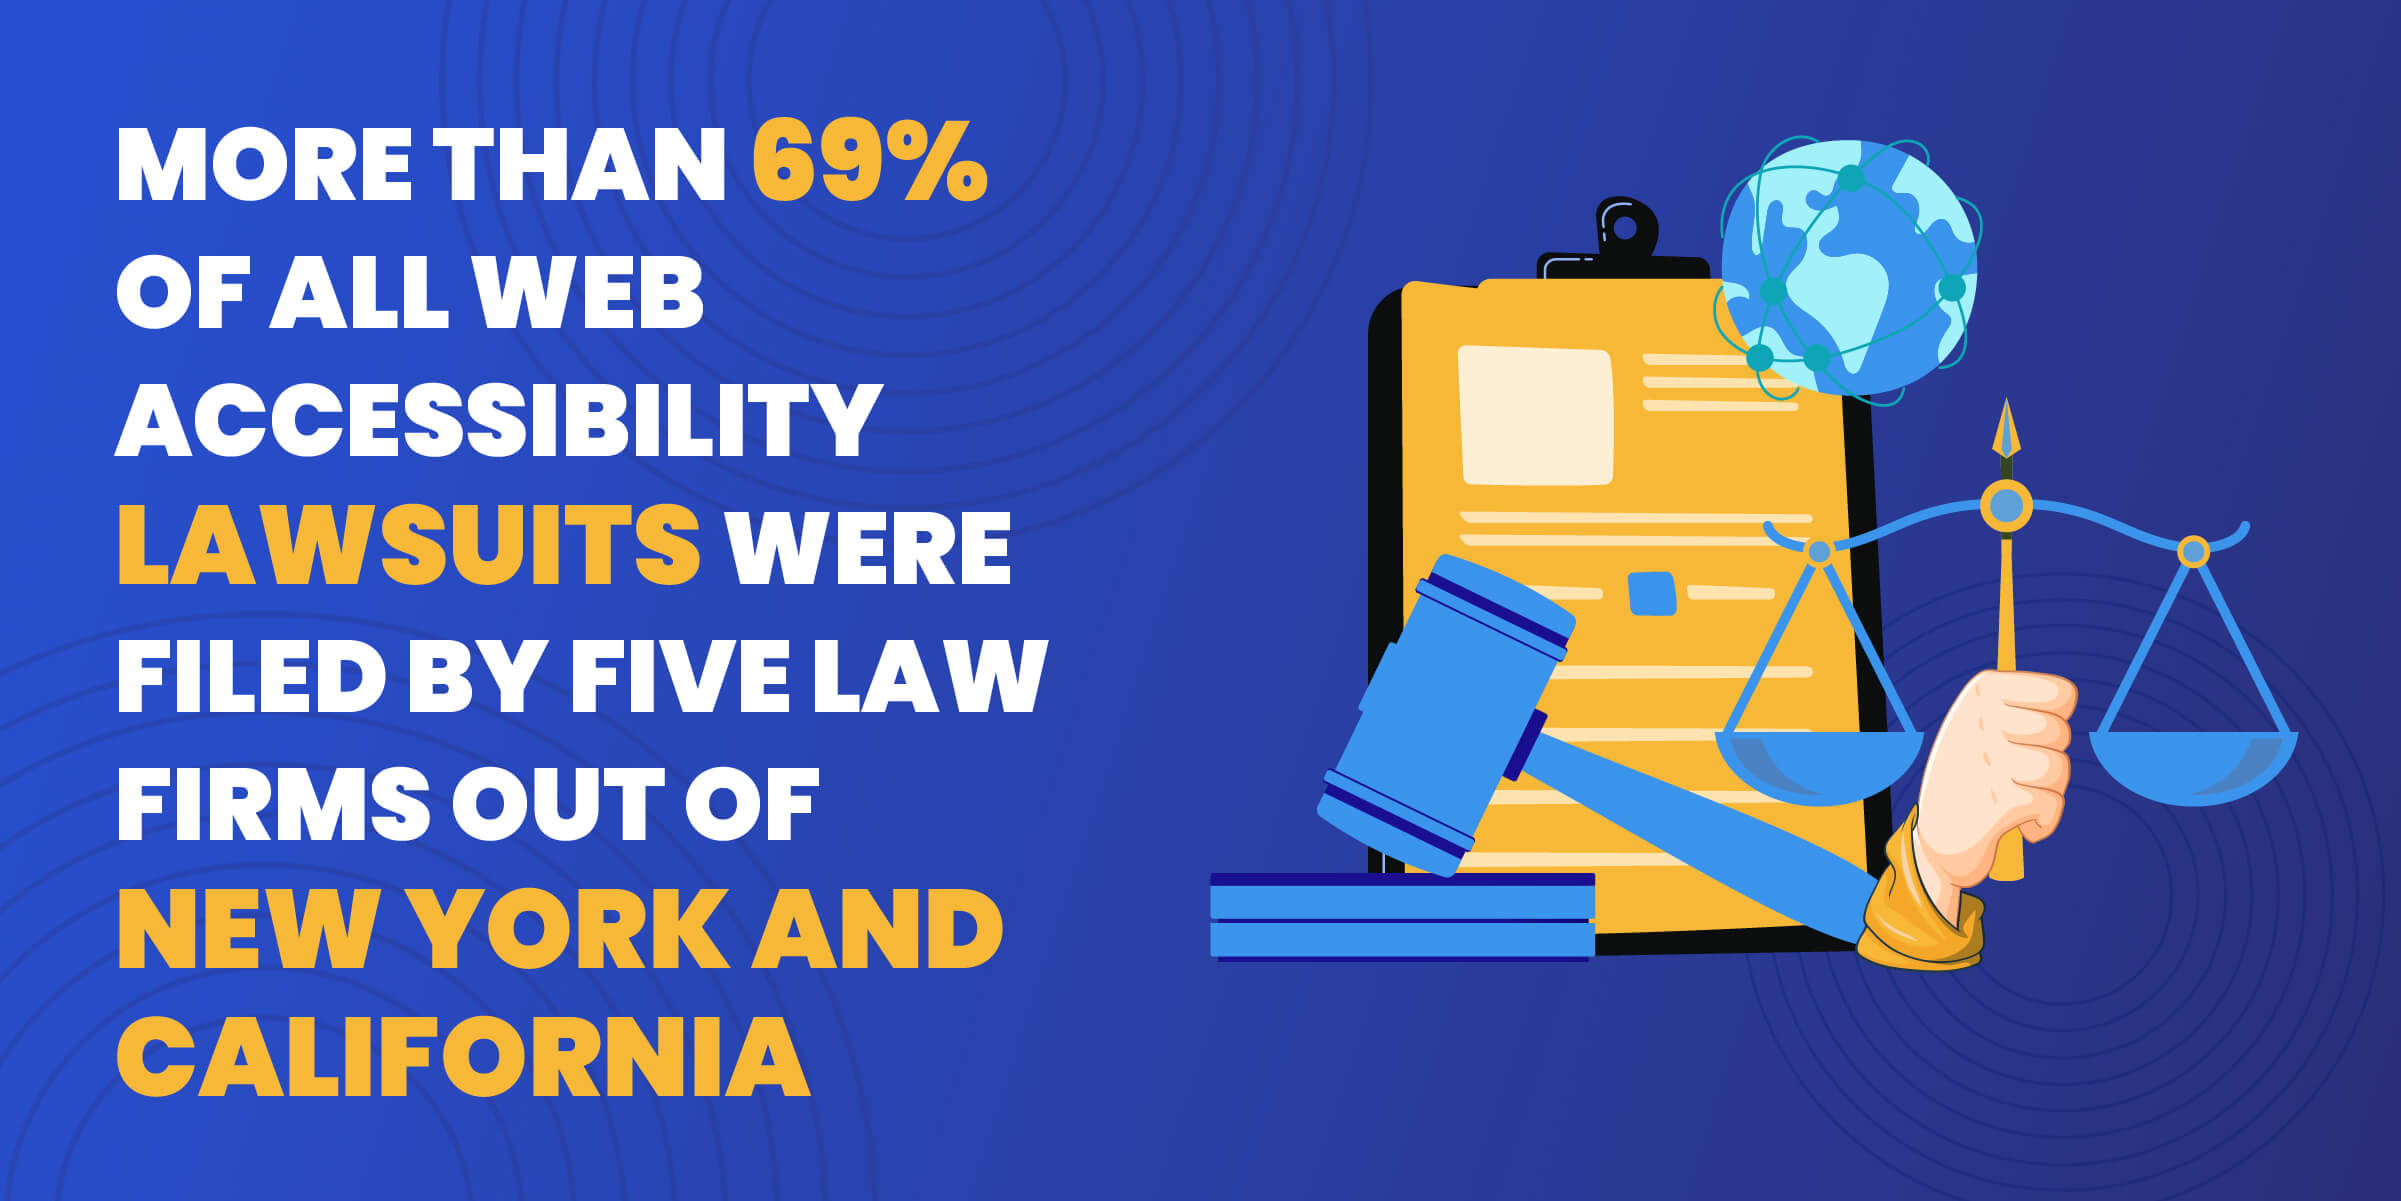
- Over 69% of all website accessibility lawsuits were filed by five law firms out of New York and California.
- WCAG 2.2 is expected to become an official recommendation in 2023 and future lawsuits may cite violations of WCAG 2.2 as evidence of ADA non-compliance.
- A 2022 analysis found a 143% year-over-year increase in the number of companies that received multiple lawsuits and predicts a 200% increase in 2023.
- Consumer Durables & Apparel, Food, Beverage & Tobacco, and Retailing sites were the subjects of the majority of lawsuits.
- 26% of lawsuits were against companies that had been sued previously.
- According to an accessibility compliance report by Ovum, 815,600 WCAG compliance issues were found among Fortune 100 companies.
Make Web Accessibility the Norm
With today’s society relying more and more on internet access, it’s irrefutably important to make these resources accessible to people with disabilities.
Updating websites with widgets and other accessible features increases user experience and allows the internet to be an available resource for all.
8 Steps To Make Your Website Accessible
To help make web accessibility the norm, here are 8 easy steps that you can take:
- Understand and Implement WCAG Guidelines: Familiarize yourself with the Web Content Accessibility Guidelines (WCAG), and apply these standards to your website.
- Perform Regular Accessibility Audits: Use both automated tools and manual testing to identify and address accessibility issues on your site. (See the section below for a list of tools.)
- Ensure Keyboard Navigation and Screen Reader Compatibility: Make all interactive elements accessible via keyboard, and ensure content is structured for screen reader compatibility.
- Provide Alt Text for Images and Media: Include descriptive alternative text for images, and provide captions or transcripts for audio and video content.
- Maintain High Color Contrast and Readable Fonts: Use sufficient contrast between text, and background and choose fonts that are easy to read.
- Design Accessible Forms and Consistent Navigation: Ensure all form elements are labeled clearly and maintain a consistent, predictable layout for easy navigation.
- Offer Text Resizing and Adjustability: This allows users to resize text without breaking the site's functionality, and offers options to adjust visual elements for better readability.
- Create an Accessibility Statement and Seek User Feedback: Publish an accessibility statement outlining your commitment and efforts, and actively seek feedback from users with disabilities to continually improve accessibility.
Accessibility Tools To Get the Job Done
Step #2 can seem a little daunting when you don’t know where to turn or how to audit your website. Here are some tools to help you get started:
- WAVE (Web Accessibility Evaluation Tool): A suite of evaluation tools that helps authors make their web content more accessible to individuals with disabilities, identifying many accessibility and WCAG errors.
- axe Accessibility Checker: An open-source tool available as a browser extension for Chrome and Firefox, used for testing web pages for accessibility issues directly within the browser.
- JAWS (Job Access With Speech): A popular screen reader for people who are blind or have low vision, providing speech and Braille output for the most popular computer applications.
- NVDA (NonVisual Desktop Access): A free and open-source screen reader for Windows, offering feedback via synthetic speech and Braille for accessible computer use.
- Lighthouse: An open-source, automated tool for improving web page quality, with audits for performance, accessibility, progressive web apps, SEO, and more, available in Google Chrome's Developer Tools.
Conclusion
Making the web more accessible is a must in today's digital world.
Websites can be more accessible by following the WCAG guidelines, doing regular audits, making sure they work with keyboards and screen readers, including alt text for media, keeping color contrast high, making forms that are easy to use, giving users the option to resize text, and asking for feedback from users.
You need to keep up with the newest technologies, changes to rules and laws, and court precedents.
Sources:
- https://www.broadbandsearch.net/blog/internet-statistics
- https://www.broadbandsearch.net/blog/internet-statistic
- https://www.statista.com/statistics/306528/share-of-mobile-internet-traffic-in-global-regions/
- https://gs.statcounter.com/browser-market-share
- https://www.demandsage.com/internet-user-statistics/
- https://www.statista.com/statistics/617136/digital-population-worldwide/
- https://www.demandsage.com/internet-user-statistics/
- https://www.broadbandsearch.net/blog/internet-statistics
- https://www.itu.int/itu-d/reports/statistics/2023/10/10/ff23-internet-use/
- https://www.itu.int/itu-d/reports/statistics/2023/10/10/ff23-internet-use/
- https://www.statista.com/statistics/262966/number-of-internet-users-in-selected-countries/
- https://explodingtopics.com/blog/countries-internet-users
- https://www.statista.com/statistics/209117/us-internet-penetration/
- https://explodingtopics.com/blog/countries-internet-users
- https://popupsmart.com/blog/wordpress-statistics
- https://monsido.com/blog/accessibility-statistics
- https://www.cdc.gov/ncbddd/disabilityandhealth/infographic-disability-impacts-all.html
- https://monsido.com/blog/accessibility-statistics
- https://www.pewresearch.org/fact-tank/2021/09/10/americans-with-disabilities-less-likely-than-those-without-to-own-some-digital-devices/
- https://www.pewresearch.org/fact-tank/2021/09/10/americans-with-disabilities-less-likely-than-those-without-to-own-some-digital-devices/
- https://webaim.org/blog/webaim-million-2022/
- https://www.cdc.gov/ncbddd/disabilityandhealth/infographic-disability-impacts-all.html
- https://www.cdc.gov/ncbddd/disabilityandhealth/infographic-disability-impacts-all.html
- https://www.cdc.gov/ncbddd/disabilityandhealth/infographic-disability-impacts-all.html
- https://www.clintoneye.com/color-blindness.html
- https://www.accessibility.com/blog/do-all-blind-users-use-screenreaders-and-other-faqs-about-this-technology
- https://www.pewresearch.org/fact-tank/2021/09/10/americans-with-disabilities-less-likely-than-those-without-to-own-some-digital-devices/
- https://www.pewresearch.org/fact-tank/2021/09/10/americans-with-disabilities-less-likely-than-those-without-to-own-some-digital-devices/
- https://www.pewresearch.org/fact-tank/2021/09/10/americans-with-disabilities-less-likely-than-those-without-to-own-some-digital-devices/
- https://www.who.int/news-room/fact-sheets/detail/deafness-and-hearing-loss#
- https://monsido.com/blog/accessibility-statistics
- https://webaim.org/blog/webaim-million-2022/
- https://webaim.org/blog/webaim-million-2022/
- https://webaim.org/blog/webaim-million-2022/
- https://webaim.org/blog/webaim-million-2022/
- https://webaim.org/blog/webaim-million-2022/
- https://webaim.org/blog/webaim-million-2022/
- https://monsido.com/blog/accessibility-statistics
- https://webaim.org/blog/webaim-million-2022/
- https://www.accessibility.works/blog/2023-wcag-ada-website-compliance-standards-requirements/
- https://www.accessibility.works/blog/2023-wcag-ada-website-compliance-standards-requirements/
- https://cielo24.com/2023/02/12-accessibility-statistics-you-need-to-know/
- https://blog.hubspot.com/website/accessibility-statistics
- https://webaim.org/projects/million/
- https://webaim.org/projects/million/
- https://webaim.org/projects/million/
- https://webaim.org/projects/million/
- https://webaim.org/projects/million/
- https://www.linkedin.com/pulse/website-lawsuit-trends-numbers-ada-related-lawsuits-amy-pierquet
- https://www.accessibility.works/blog/2023-ada-website-lawsuits-legal-statistics
- https://www.accessibility.com/complete-report-2023-website-accessibility-lawsuits
- https://www.accessibility.com/complete-report-2023-website-accessibility-lawsuits
- https://www.boia.org/blog/2022-web-accessibility-lawsuits-recap-4-key-takeaways
- https://www.boia.org/blog/2022-web-accessibility-lawsuits-recap-4-key-takeaways
- https://www.boia.org/blog/2022-web-accessibility-lawsuits-recap-4-key-takeaways
- https://www.accessibility.com/complete-report-2023-website-accessibility-lawsuits
- https://cielo24.com/2023/02/12-accessibility-statistics-you-need-to-know/