Is PPC still all it’s cracked up to be?
Here are 73 PPC statistics, trends, and insights for 2026.
(Did you count how many rhymes that was???)
Need an expert quote for your story? We’re happy to help. Contact our Editor & Founder, Geoff Cudd.
We offer this website completely free to our visitors. To help pay the bills, we’ll often (but not always) set up affiliate relationships with the top providers after selecting our favorites. However, we do our best not to let this impact our choices. There are plenty of high-paying companies we’ve turned down because we didn’t like their product.
An added benefit of our relationships is that we always try to negotiate exclusive discounts for our visitors.
Key PPC Statistics
As always, the highlights:
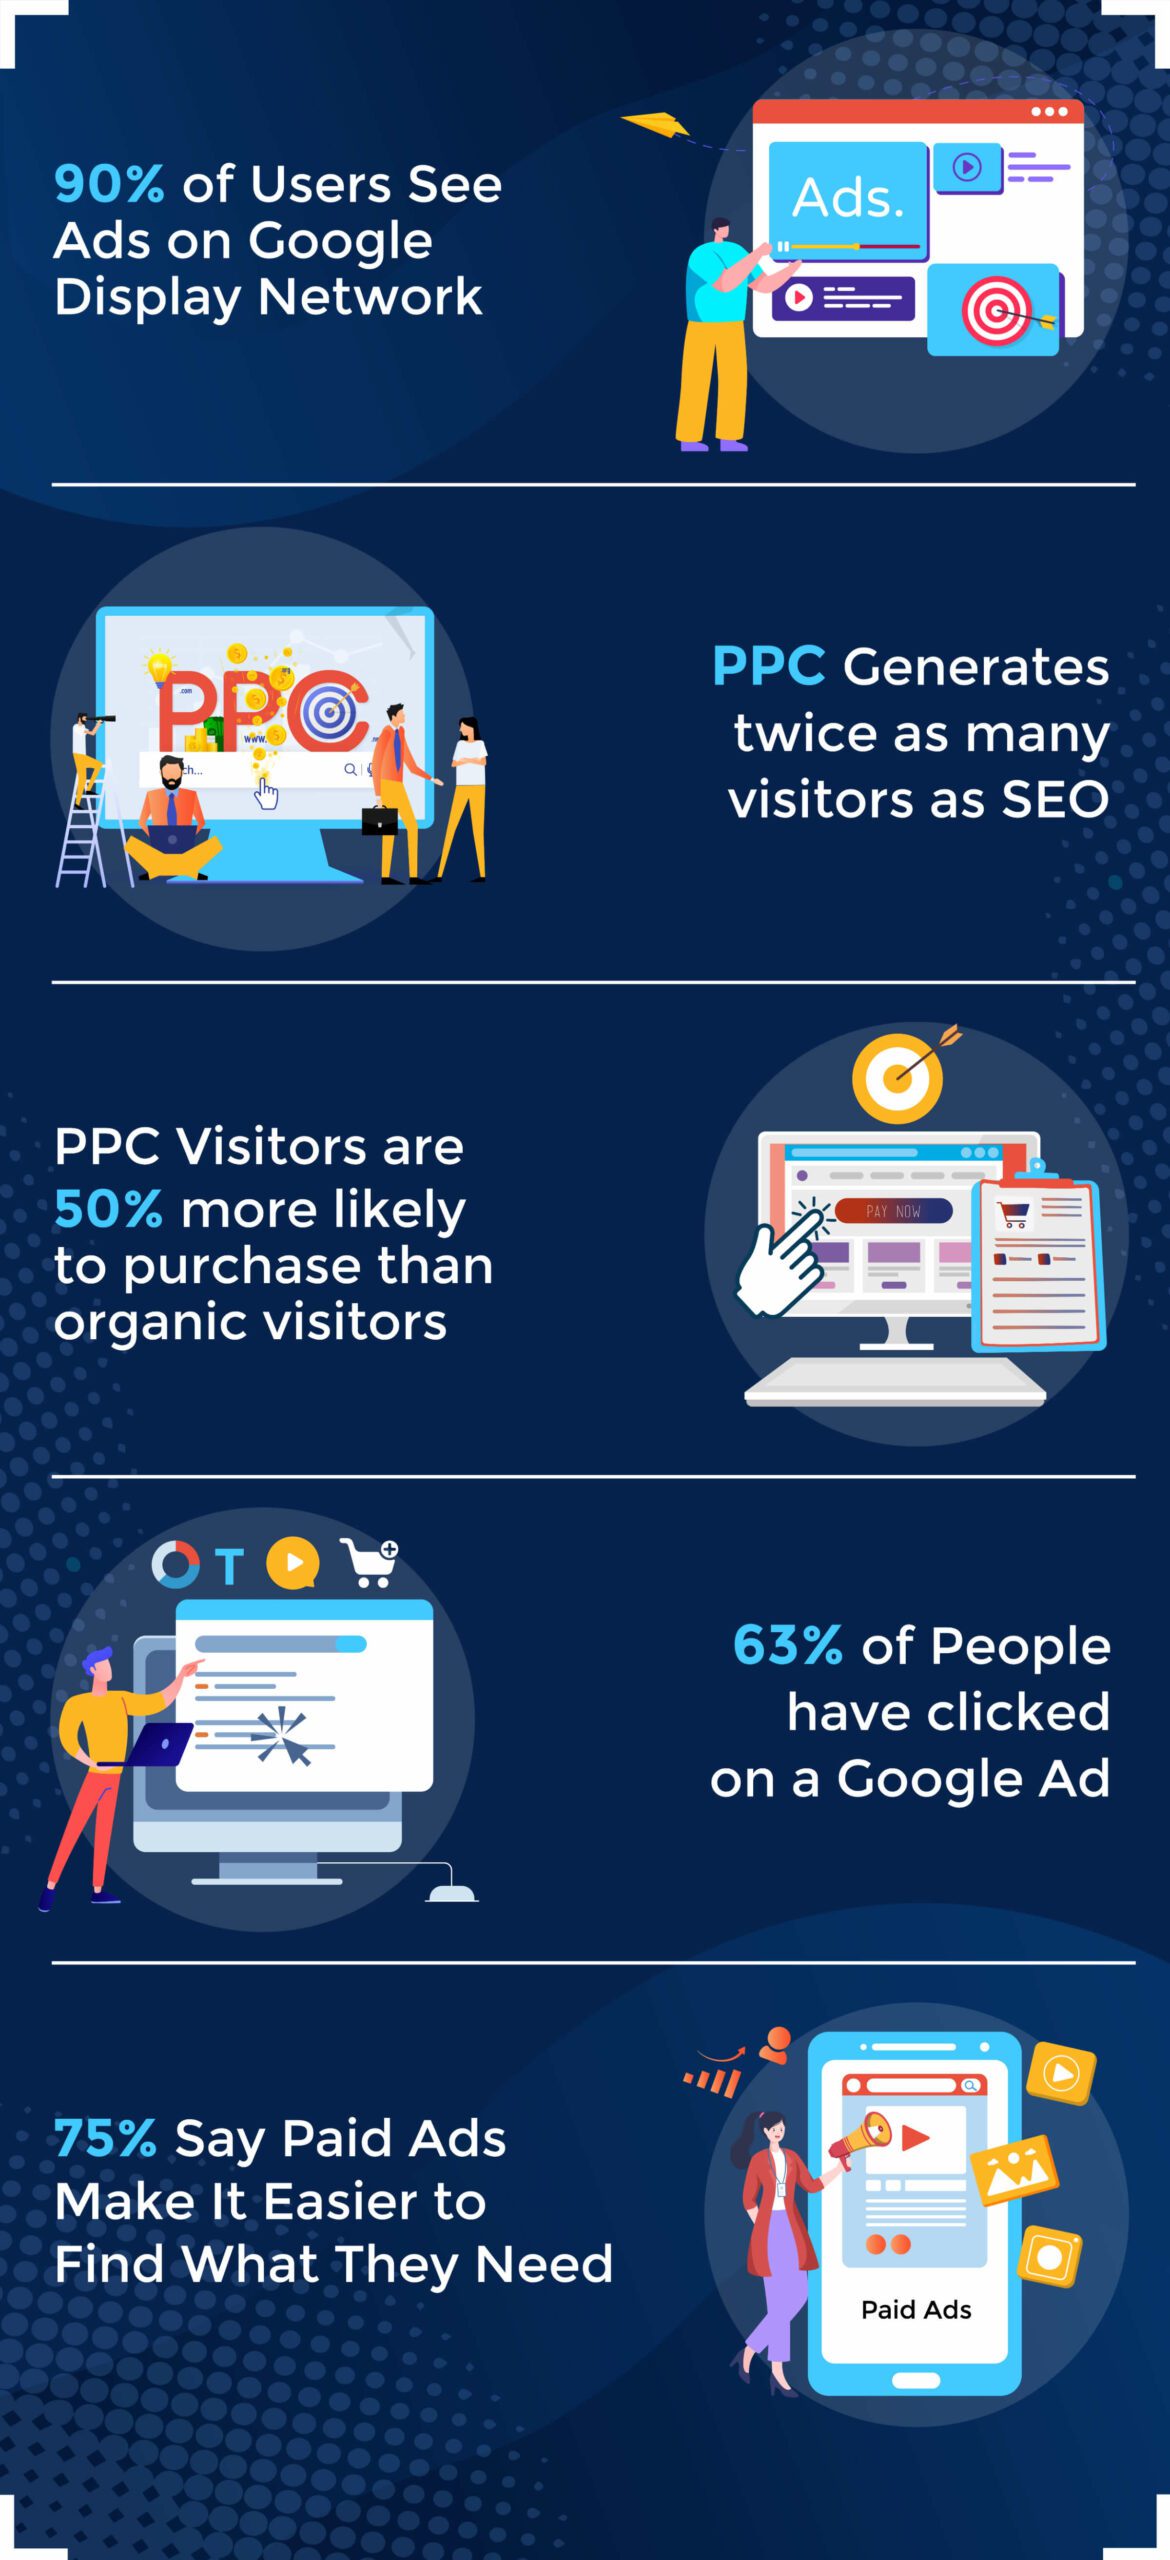
- 90% of internet users see ads placed on the Google Display Network.
- PPC visitors are 50% more likely to make a purchase than organic visitors.
- Businesses make $2 for every $1 spent on PPC.
- 63% of people have clicked on a Google Ad.
- Google (GOOGL) generated $54.48 billion in advertising revenue during Q3 2022.
- 75% of people say paid ads make it easier to find what they need.
- PPC generates twice the number of visitors compared to SEO.
Google Ad Statistics
Google Ads is still the king of PPC, holding the lion’s market share when it comes to this popular marketing strategy.
- Google estimates that search clicks are about 70% as valuable as ad clicks.
- Google Ads conservatively estimates that for every $1 a business spends on Google Ads, they receive $8 in profit through Google Search and Ads.
- As much as 80.5% of Google’s revenue comes from ads.
- The average cost-per-click on Google AdWords is between $1 and $2.
- The average conversion rate for Google Ads is 3.75%.
- Google owns 76% of the search engine market share.
- The average CTR for Google Ads is 1.91% (for the Search Network) and 0.35% (for the Display Network).
- Over 50% of people between the ages of 18–34 can’t differentiate between an ad and an organic result on Google.
- Google Ads results receive 65% of the clicks for content that started with buying keywords, while organic results only receive 35%.
- 89% of the traffic generated by Google Ads is not replaced by organic clicks when ads are paused.
- 80% of businesses use Google Ads for PPC ad campaigns.
- 78% of marketers advertise on Google Ads and social media.
Shopping PPC Statistics
Here’s how PPC can help your e-commerce business attract the business of the over 2 and a half billion online shoppers projected for 2024.
- Google Shopping ads currently drive 76.4% of retail search ad spend.
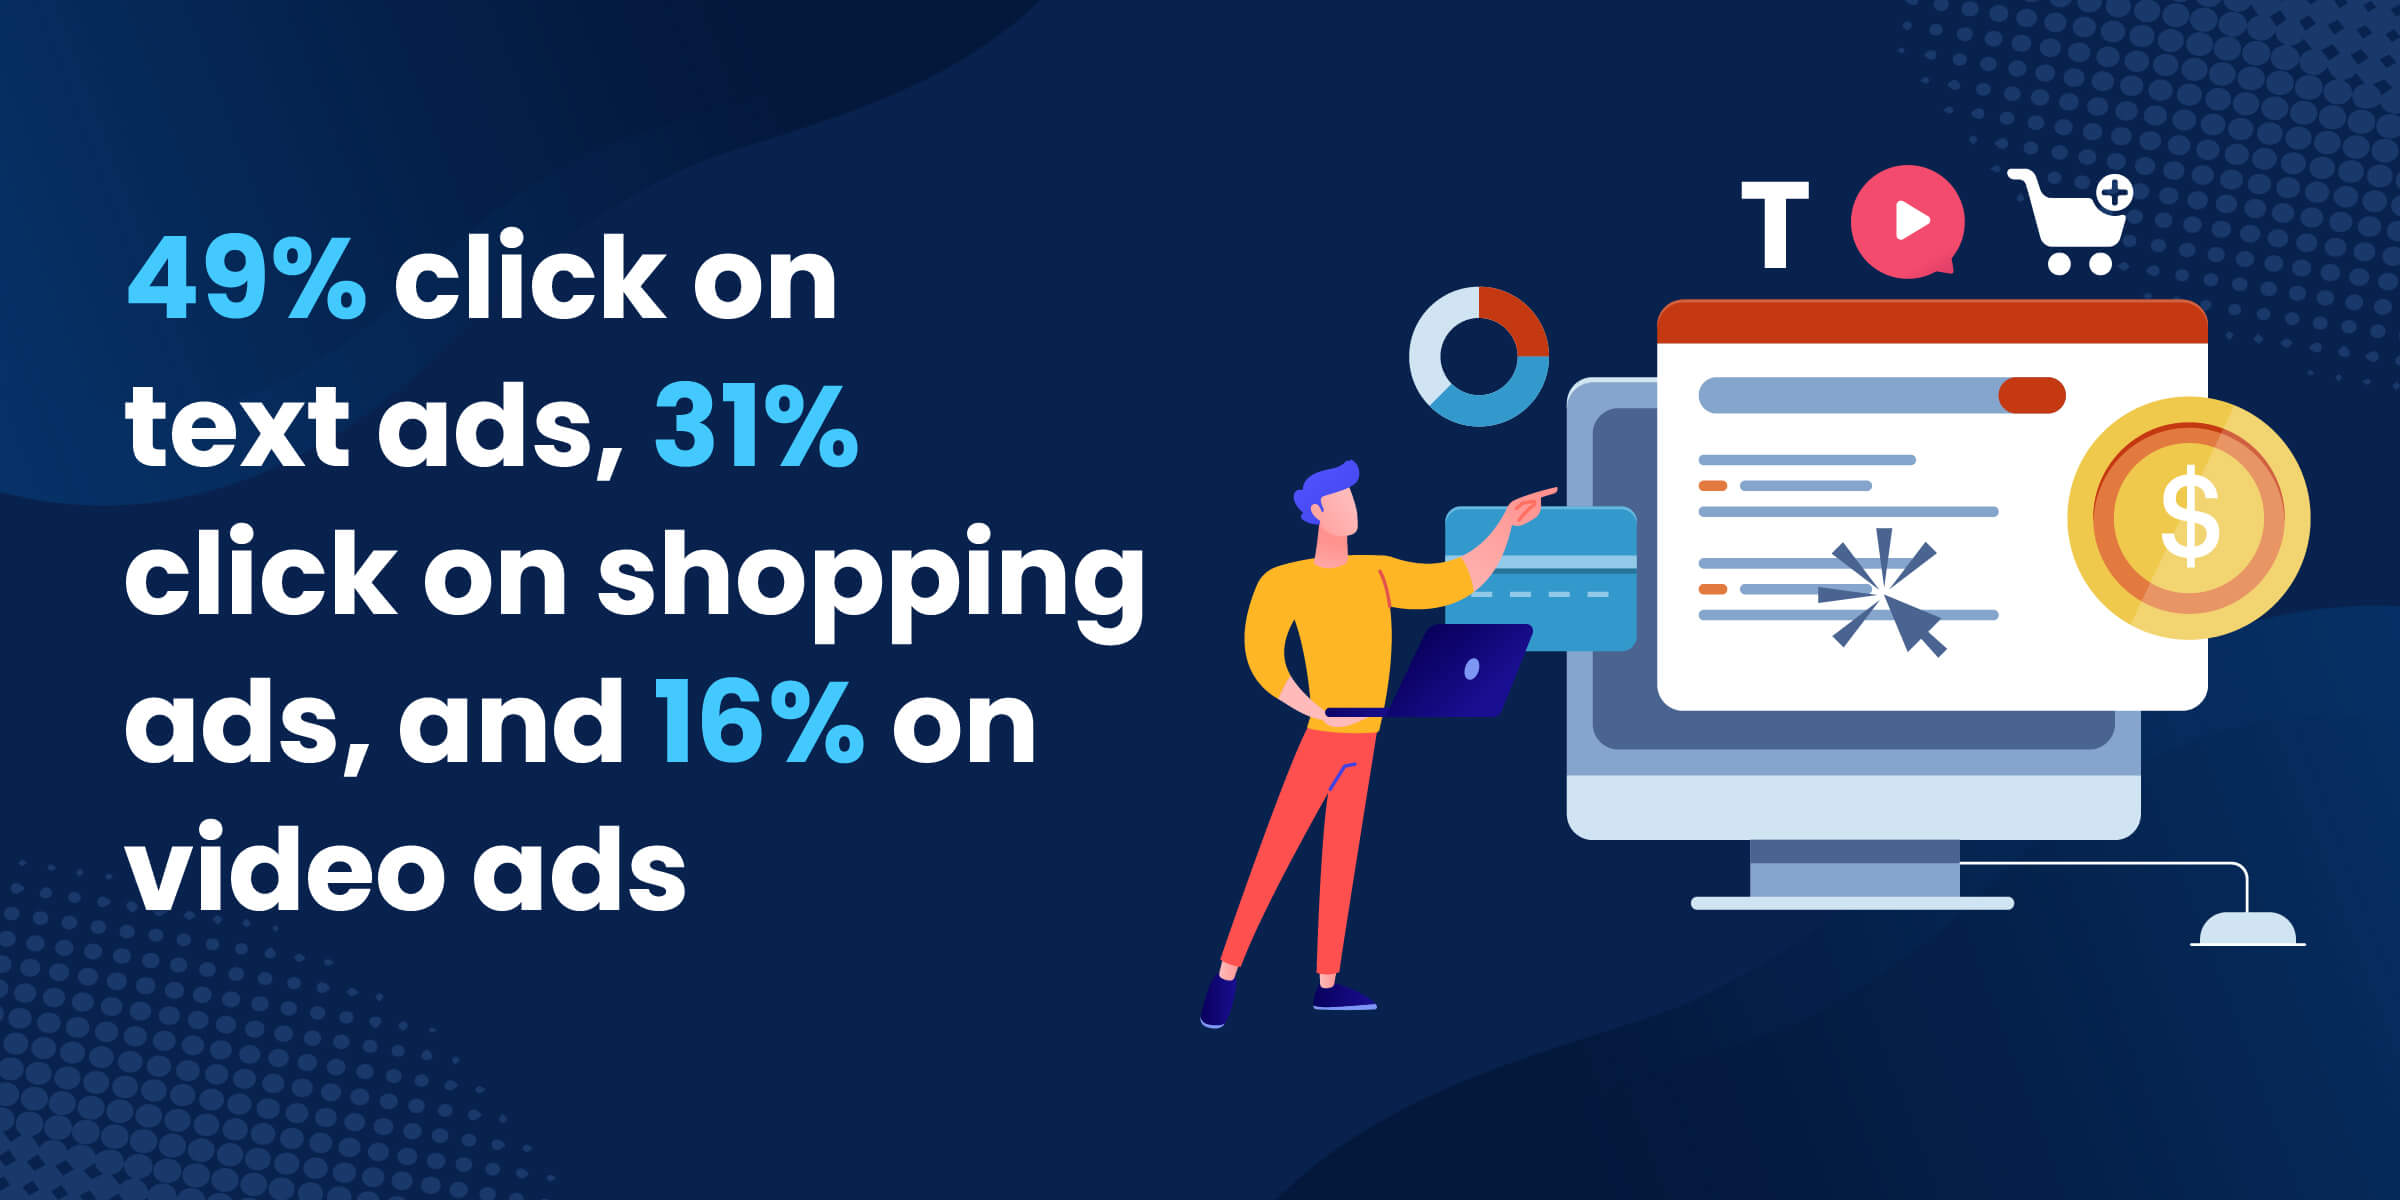
- 49% of people said they click on text ads. 31% click on Shopping ads and 16% on video ads.
- Amazon is expected to drive a majority of the PPC market's growth in 2024, as it is forecast to see ad revenues rise 16.7% from $45.4 billion to $52.7 billion.
- 60% of shopping queries on Google Search are users looking for inspiration when narrowing down their search to find a specific product.
- 2.71 billion people will shop online in 2024.
- 52% of online shoppers who click on or view paid advertisements call that advertiser right after browsing.
- 71% of potential buyers prefer ads that are customized to their interests and shopping habits.
- Shopping ads on Google successfully generate 20% of clicks for retail paid search.
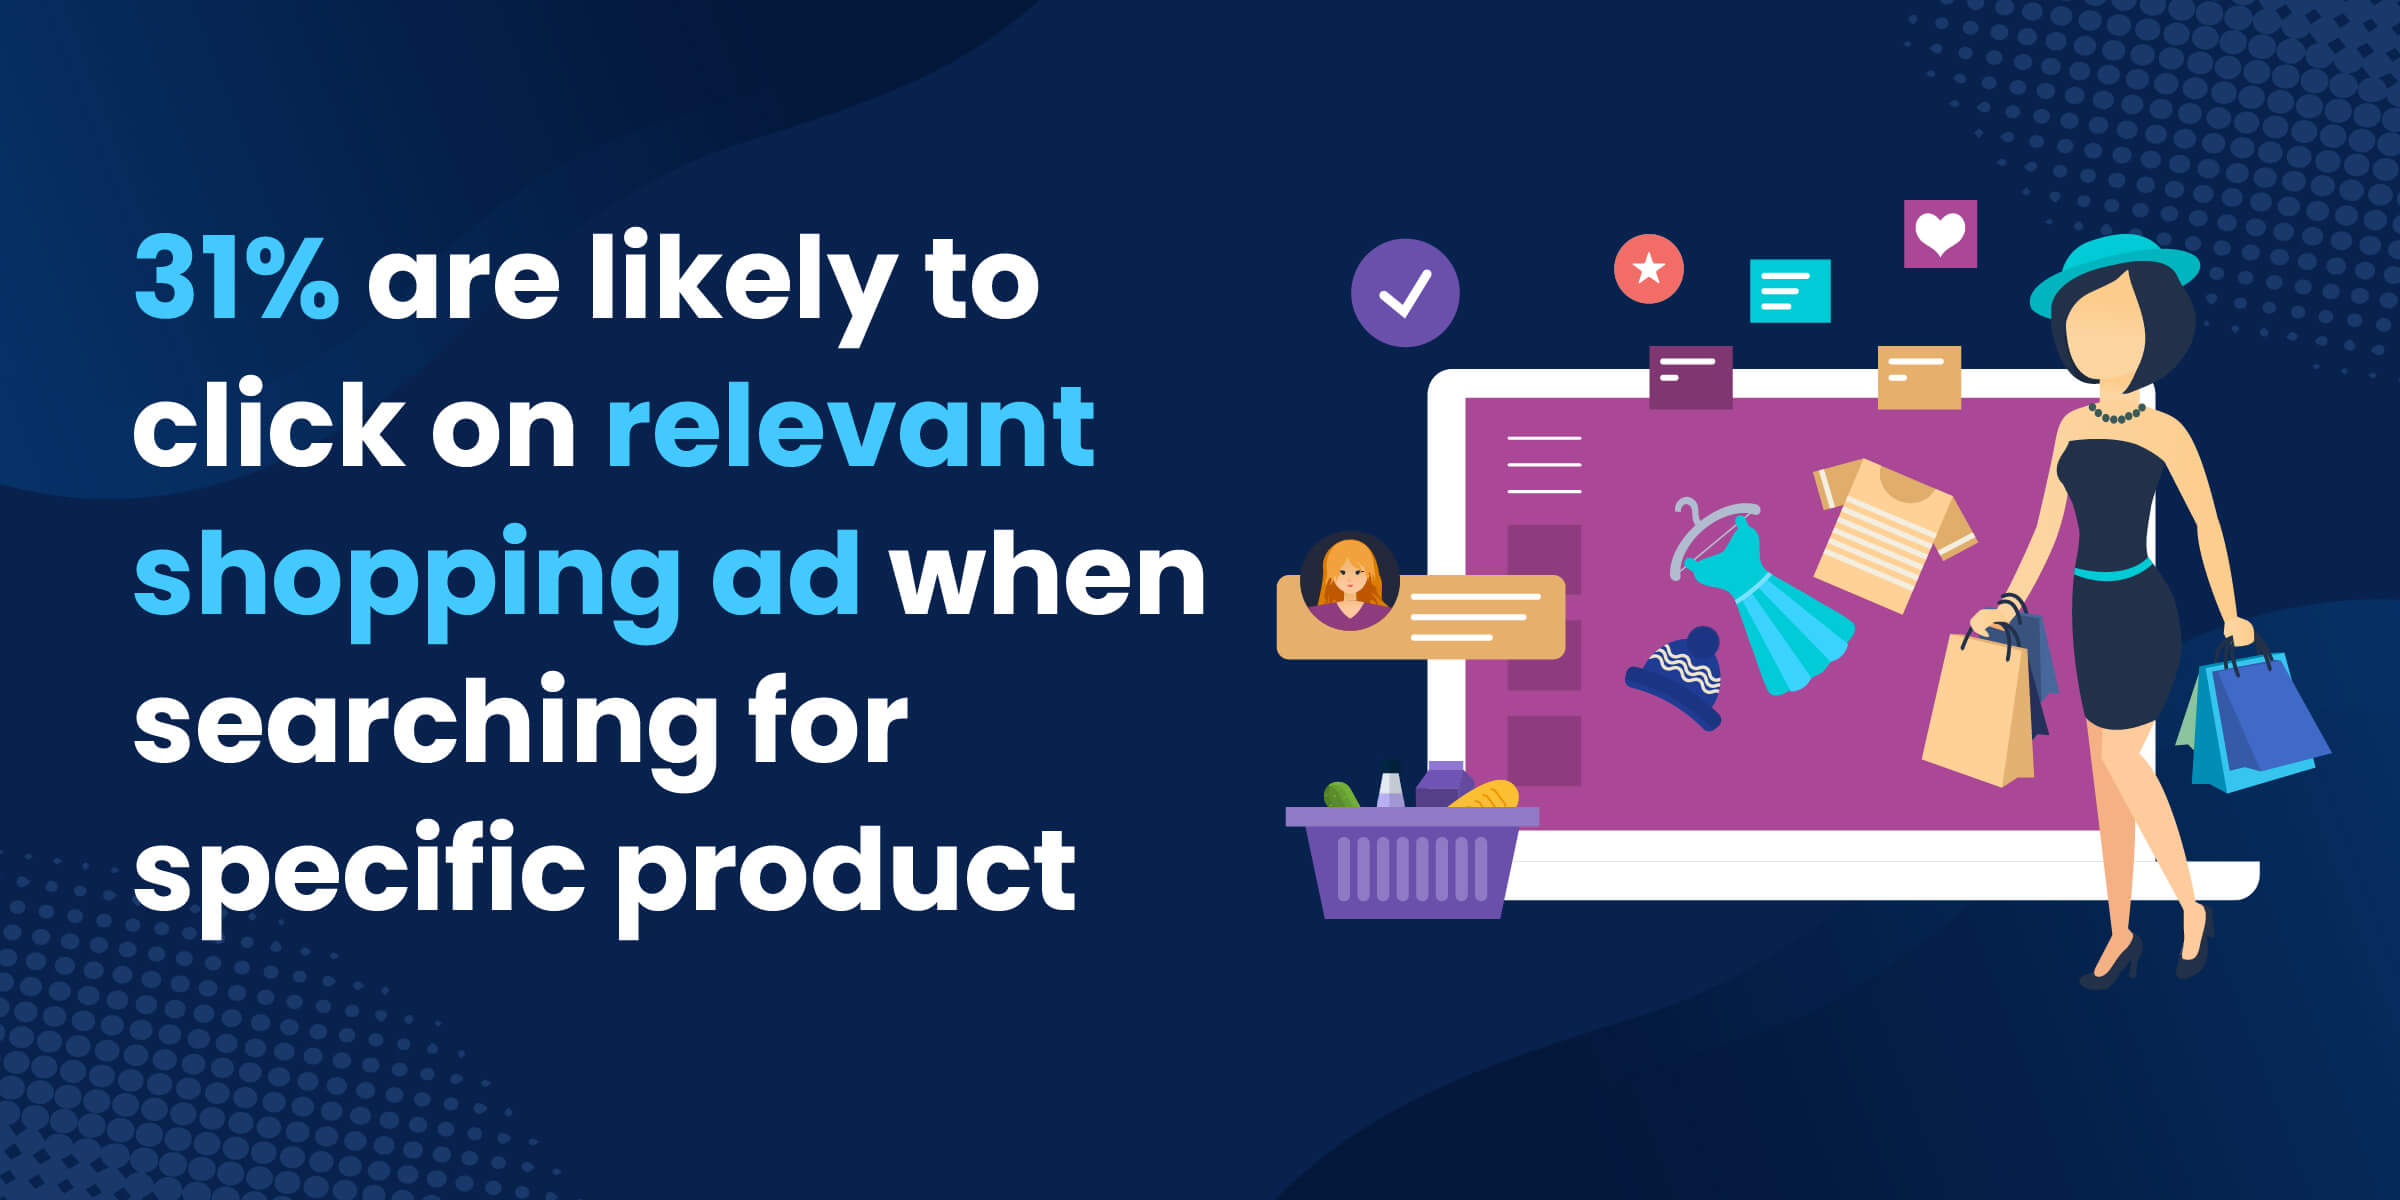
- 31% of people searching for a specific product online are likely to click on relevant shopping PPC ads.
- 65% of advertisers use product images to increase sales.
- 74% of Amazon sellers sponsored products and brands to promote their products, while 24% used Google shopping.
PPC Spending and Cost Statistics
We’re talking BILLIONS again.
Here’s what CPC and spending look like this year.
(P.S. check out our PPC specialist hiring guide to save money and time on your business’s PPC strategy!)
- Ad spending in the Search Advertising market is projected to reach US$132.0bn in 2024.
- The spending on PPC for 2024 is projected to reach $190.5 billion.
- The average annual cost of leveraging PPC ads is $108,000-$120,000.
- Small to medium-sized companies spend $9,000-$10,000 monthly on PPC ads on average.
- The average yearly cost for B2B PPC ads is between $115,000 and $122,000.
- The legal industry has the highest average CPC at $8.67 for Google Ads.
- The average overall lowest price of CPC in Google Ads is $1.40.
- 40% of businesses would like their PPC budgets to be bigger.
- 64% of brands are planning to increase their PPC budget in the next 12 months.
- 96% of brands are spending money on Google Ads.
- 42% of all digital marketing spending is search marketing.
- $0.91 is Amazon’s average CPC.
- Almost half of marketers operate with a monthly PPC budget under $50,000.
PPC ROI Statistics
Just how much money will you see back from that PPC investment?
- A recent Google study revealed it made an average of 800% ROI on Google Ads.
- Facebook businesses report an ROI of 152% from social media marketing.
- 30% of US ad buyers say that Facebook offers the highest ROI from all of their advertising investments.

Mobile Advertising PPC Statistics
Unsurprisingly, mobile advertising is the most important focus of PPC marketing strategy.
- Mobile will bring in $93.84 billion in US programmatic digital ad spend this year.
- Google drives 95% of the search ad clicks earned from mobile devices.
- 70% of impressions for search ads are on mobile.
- 53% of clicks generated by PPC ads come from a mobile device.
- Mobile apps were expected to generate $935 billion in-app and paid advertising in 2023.
- Two-thirds of mobile users generate at least one click for a PPC ad weekly.
- Mobile advertising spend in the U.S. is expected to reach $216.4 billion in 2024.
- PPC ads are clicked by 60% of mobile users at least once a week.
- Mobile searches are done by 90% of mobile owners.
- Shopping is done by 69% of smartphone users.
- 61.9% of Google ad clicks come from mobile devices.
- 95% of paid search ad clicks on mobile are driven by Google.
- 70% of mobile users call their target business directly through Google Ads.
- More than 615 million devices have ad blockers.

- 65% of people use mobile in their “I-want-to-buy” moments.
- Mobile devices comprised 49.78% of all web visitors, with PCs accounting for 50.22%.
- Over 40% of online transactions now happen on mobile.
PPC Conversion Rates and Effectiveness (PPC Results Statistics)
Let’s see some RESULTS!
(For the BEST results, consider hiring a PPC marketing agency.)
- The average conversion rate for Google ads across industries is 7.04%.
- Facebook ads have a conversion rate of 1.51%.
- Clicks for sponsored brands and products have a conversion rate 3x that of Google Shopping ads.
- The average CTR for Google ads is 2%.
- Click-throughs from PPC results convert at a 1.5x higher rate than their organic counterparts.
- The highest average click-through rate in Google AdWords is found in the dating and personal industry, while the lowest click-through rate is found in the legal industry.
- The likelihood of PPC visitors making a purchase is 50% greater than it is with organic visitors.
- Combining audience with remarketing campaigns boosts conversion rates by 40%.
- The arts & crafts industry has the highest e-commerce conversion rate, at 4.01%.
- According to recent studies, organic search has a 2% to 4 % conversion rate, while PPC has a 2.35% conversion rate.
Frequently Asked Questions
How do you calculate PPC?
To calculate PPC, subtract your PPC spend from your PPC revenue, then divide this number by your PPC spend to get a percentage.
What does PPC data mean?
PPC data is the information gathered from PPC campaigns, including data from Google Ads, SEO campaigns, or Amazon Ads.
How does PPC marketing work?
PPC (pay-per-click) is an online advertising technique where advertisers run ads on a platform like Google Ads and pay a fee every time someone clicks on these ads.
What is PPC in Google Ads?
Google Ads is Google’s own PPC model, where businesses pay Google for PPC advertising on the search engine’s platform.
How do you make money with PPC?
You make money with PPC by receiving enough clicks and conversions to outweigh the CPC (cost-per-click) of your PPC ads.
How much should you spend on PPC per month?
Small to medium-sized businesses spend $9,000 to $20,000 per month on PPC.
Sources:
- https://websitebuilder.org/ppc-stats/
- https://websitebuilder.org/ppc-stats/
- https://www.webfx.com/blog/marketing/ppc-strategies/
- https://thesocialshepherd.com/blog/google-ads-ppc-statistics
- https://www.shacknews.com/article/132832/google-googl-q2-2022-ad-revenue
- https://www.digitalthirdcoast.com/blog/ppc-statistics
- https://techjury.net/blog/ppc-stats/
- https://economicimpact.google/methodology/
- https://economicimpact.google/methodology/
- https://websitebuilder.org/ppc-stats/
- https://www.webfx.com/blog/marketing/google-adwords-vs-bing-ads/
- https://www.webfx.com/blog/marketing/google-adwords-vs-bing-ads/
- https://www.webfx.com/blog/marketing/google-adwords-vs-bing-ads/
- https://www.webfx.com/blog/marketing/google-adwords-vs-bing-ads/
- https://searchengineland.com/can-searchers-tell-the-difference-between-ads-and-free-listings-google-engineer-says-yes-309798
- https://www.askmedigi.com/googleads-ppc-newupdate-2020-statistics/
- https://lunio.ai/statistics/ppc-statistics/
- https://techjury.net/blog/ppc-stats/
- https://techjury.net/blog/ppc-stats/
- https://www.smartinsights.com/digital-marketing-strategy/the-rise-of-google-shopping/
- https://www.digitalthirdcoast.com/blog/ppc-statistics
- https://www.forbes.com/sites/bethkindig/2023/12/27/ad-spending-growth-to-accelerate-in-2024/
- https://www.thinkwithgoogle.com/data/upper-funnel-shopping-search-data/
- https://www.oberlo.com/statistics/how-many-people-shop-online
- https://www.smallbizgenius.net/by-the-numbers/ppc-stats/#gref
- https://www.marketingdive.com/news/study-71-of-consumers-prefer-personalized-ads/418831/
- https://www.forbes.com/sites/roberthof/2015/01/27/google-shopping-ads-score-big-with-retailers/?sh=4f0cbb237324
- https://searchengineland.com/what-makes-people-click-on-search-ads-309959
- https://www.searchenginejournal.com/paid-search-is-still-the-dominant-digital-ad-channel-in-2019/317371/
- https://feedvisor.com/resources/amazon-marketing-advertising-strategies/amazon-sponsored-products-vs-google-shopping-a-comparison-of-advertising-giants/
- https://www.statista.com/outlook/dmo/digital-advertising/search-advertising/united-states
- https://techreport.com/statistics/ppc-statistics/
- https://www.ranktracker.com/blog/the-power-of-ads-and-ppc-statistics/
- https://www.linkedin.com/pulse/ppc-management-costs-breakdown-2022-m-shahan
- https://techjury.net/blog/ppc-stats/#gref
- https://www.wordstream.com/blog/ws/2015/05/21/how-much-does-adwords-cost
- https://www.wordstream.com/blog/ws/2015/05/21/how-much-does-adwords-cost
- https://www.smallbizgenius.net/by-the-numbers/ppc-stats/#gref
- https://ppcprotect.com/ppc-statistics/
- https://lunio.ai/statistics/ppc-statistics/
- https://www.webfx.com/ppc/statistics/
- https://www.adbadger.com/blog/amazon-advertising-stats/
- https://techjury.net/blog/ppc-stats/
- https://www.wordstream.com/blog/ws/2015/05/21/how-much-does-adwords-cost
- https://techjury.net/blog/social-media-roi-statistics/
- https://truelist.co/blog/ppc-stats/
- https://www.insiderintelligence.com/content/programmatic-ad-spend-has-gotten-more-diverse-mobile-dominated
- https://searchengineland.com/google-drove-95-percent-us-smartphone-paid-search-clicks-q1-merkle-247731
- https://lunio.ai/statistics/ppc-statistics/
- https://www.powertraffick.com/ppc-trends-and-statistics
- https://www.statista.com/statistics/269025/worldwide-mobile-app-revenue-forecast/
- https://www.rankingbyseo.com/blog/ppc-statistics/
- https://www.oberlo.com/statistics/mobile-advertising-growth
- https://techjury.net/blog/ppc-stats/
- https://www.emarketer.com/content/mobile-search-ad-performance-plays-catch-up
- https://www.smallbizgenius.net/by-the-numbers/ppc-stats/
- https://quoracreative.com/article/mobile-marketing-statistics
- https://www.webfx.com/blog/marketing/ppc-stats/
- https://www.digitalthirdcoast.com/blog/ppc-statistics
- https://techjury.net/blog/ppc-stats/
- https://www.socialmediatoday.com/news/60-seo-stats-to-help-you-rank-better-in-2019-infographic/547866/
- https://techjury.net/blog/mobile-vs-desktop-usage/
- https://techjury.net/blog/mobile-vs-desktop-usage/
- https://www.wordstream.com/blog/conversion-rate-optimization-statistics
- https://growthmarketinggenie.com/blog/facebook-ads-benchmarks-across-various-industries-2024/
- https://www.mediapost.com/publications/article/324306/marketers-spent-165-more-on-amazon-sponsored-prod.html
- https://www.wordstream.com/average-ctr
- https://blog.atomicreach.com/ppc-statistics
- https://valveandmeter.com/pay-per-click-statistics/
- https://websitebuilder.org/ppc-stats/
- https://techjury.net/blog/ppc-stats/
- https://techjury.net/blog/conversion-rate-stats/
- https://optinmonster.com/reasons-your-ecommerce-site-has-a-low-conversion-rate/